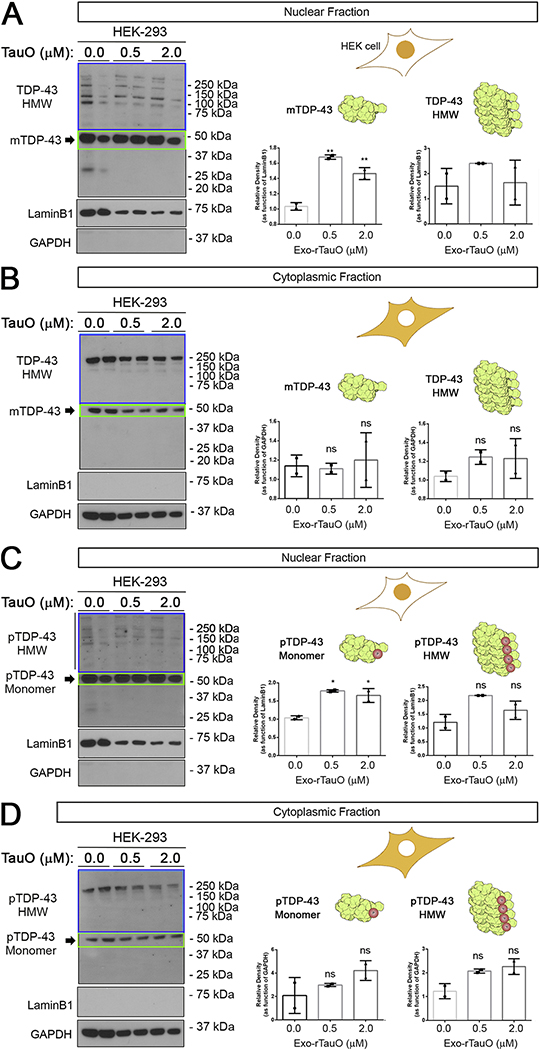
Figure 1. Exo-rTauO alter TDP-43 localization in HEK-293 cells.
(A) IB of HEK-293 nuclear fractions incubated with rTauO (0.5 and 2.0 μM), probed with a commercial TDP-43 antibody (Ab109535). Significant increases of monomeric TDP-43 were observed in 0.5 and 2.0 μM treated cells (F: 69.59, P value: 0.0031, **p<0.05 R square: 0.9789), with no significant difference in HMW TDP-43 (P value: 0.4394). (B) IB of TDP-43 cytoplasmic fractions of HEK-293 cells incubated with rTauO (0.5 and 2.0μM) did not show significant differences in cytoplasmic TDP-43 levels (TDP-43 monomer P value: 0.8818, TDP-43 HMW P value: 0.3636). (C) IB of pTDP-43 nuclear fractions of HEK-293 incubated with rTauO (0.5 and 2.0 μM) showing a significant increase (F: 22.73, P value: 0.0154, *p<0.05, R square: 0.9381) of monomeric pTDP-43 with no significant HMW pTDP-43 (P value: 0.0702). (D) IB of pTDP-43 cytoplasmic fractions of HEK-293 incubated with rTauO (0.5 and 2.0 μM). No significant differences was observed for monomeric (P value: 0.2570) or HMW pTDP-43 (P value: 0.0585). Monomer (green box) and HMW (blue box) TDP-43 are quantified and presented in separate bar graphs (Mean±SD). LaminB1 and GAPDH were used as loading controls for the nuclear and cytoplasmic fractions, respectively. Ordinary one-way ANOVA with Dunnett’s multiple comparison test was performed among the three groups in three independent experiments. The HEK-293 schematic cell is represented with the nuclei or cytoplasm in orange to indicate the analyzed compartment. mTDP-43 and HMW TDP-43 are represented by a rendered NMR structure of RNA-Motif domains of TDP-43 (Uniprot Number: 4BS2). Drawings and protein renderings were produced with Bio Render Software.

