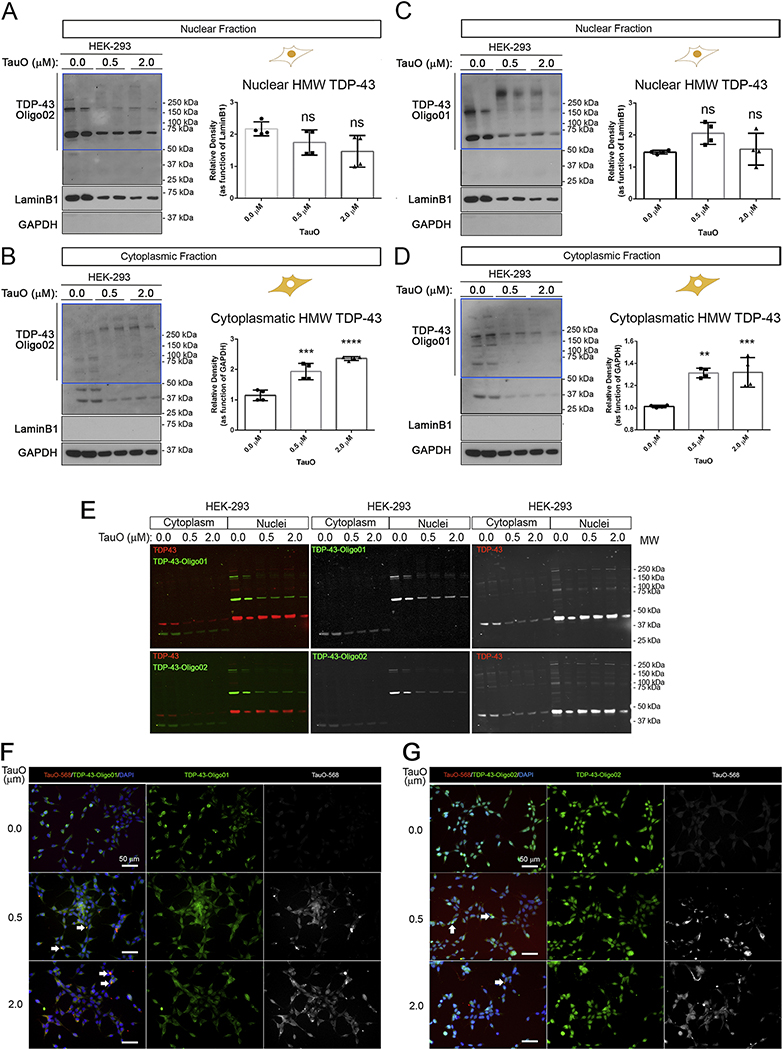
Figure 2. Exo-rTauO induce cytoplasmic TDP-43O accumulation.
(A) IB of nuclear fractions from HEK-293 untreated and treated with TauO 0.5 and 2.0 μM probed with TDP-43-Oligo02 antibody. Relative densitometry of HMW (blue box) is represented (P value: 0.0806). (B) IB of cytoplasmic fractions from HEK-293 untreated and incubated with TauO (0.5 and 2.0 μM) probed with TDP-43-Oligo02 antibody. Relative densitometry of HMW (blue box) is presented (F: 42.74, P value: <0.0001, R square: 0.9047). (C) IB of nuclear fractions from HEK-293 cells untreated and treated with TauO (0.5 and 2.0 μM) with TDP-43-Oligo01 antibody. Relative densitometry of HMW TDP-43 (blue box) is represented (P value: 0.0866). (D) IB of cytoplasmic fractions of HEK-293 cells untreated and treated in with TauO (0.5 and 2.0 μM) with TDP-43-Oligo01 antibody. Relative densitometry of HMW (blue box) is represented (F: 18.50, P value: 0.0006, R square 0.8044). All sections present relative quantification of TDP-43Os and values are presented in separate bar graphs (Mean±SD). LaminB1 and GAPDH have been used as loading control for nuclear and cytoplasmic fractions, respectively. Ordinary one-way ANOVA with Dunnett’s multiple comparison test was performed among the three groups in three independent experiments. TDP-43 Oligo01 and TDP-43 Oligo02 immunoblots were conducted in the same membrane. (E) Immunofluorescence blots (LI-COR system) of commercial TDP-43 (red) and TDP-43 Oligo01 and Oligo02 (green) Abs in HEK-293 cells treated with TauOs. Colored merge and single gray channels (TDP-43O Abs) are represented. (F) Representative IF images of HEK-293 treated with labeled TauO-AF568 (0.5 and 2.0 μM) and stained with TDP-43 Oligo01 (green) and DAPI (nuclei, blue). Magnification: 40x and white scale bar: 50 μm. (G). Representative IF images of HEK-293 treated with labeled TauO-AF568 (0.5 and 2.0 μM) and stained with TDP-43 Oligo02 (green) and DAPI (nuclei, blue). Magnification: 40x and white scale bar: 50 μm. White arrows in F and G indicate overlapping signal for TauO-568 and TDP-43Os.

