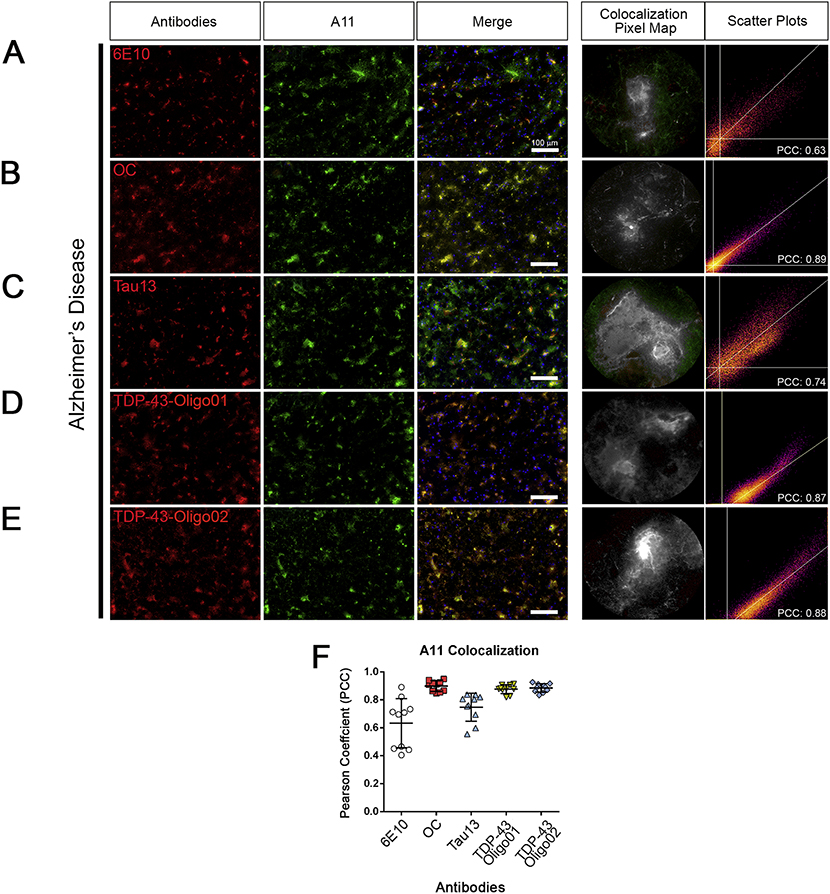
Figure 5. TDP-43Os co-localize with oligomeric Aβ structures in AD brain.
(A) Representative immunofluorescence images of cortical brain tissue sections from patients with AD stained with A11 (green) and 6E10 (red). Merge is presented along with a representative co-localization pixel map and intensity scatter plot. (B) IF co-staining with A11 (green) with OC (red). Merge is presented with a representative co-localization pixel map and intensity scatter plot. (C) IF co-staining of A11 (green) with Tau13 (red). Merge is presented with a representative co-localization pixel map and intensity scatter plot (PCC=0.89). (D) IF co-staining with A11 (green) with TDP-43-Oligo01 (red). Merge is presented with a representative co-localization pixel map and intensity scatter plot (PCC=0.87). (E) IF co-staining of A11 (green) with TDP-43-Oligo02 (red). Merge is presented with a representative co-localization pixel map and intensity scatter plot (PCC=0.88). (F) Pearson coefficient scatter plot of combined co-staining of A11 with OC, Tau13, TDP-43-Oligo01, andTDP-43-Oligo02 (from left to right). All images were taken with a 20x objective and represented in green (A11), red (other antibodies) and merge, white scale bar: 100 μm. Representative co-localization (green+red=grey) pixel maps represent random ROIs enlarged, and the scatter plot is related to those 10 ROIs (n=3 for each AD case analyzed).

