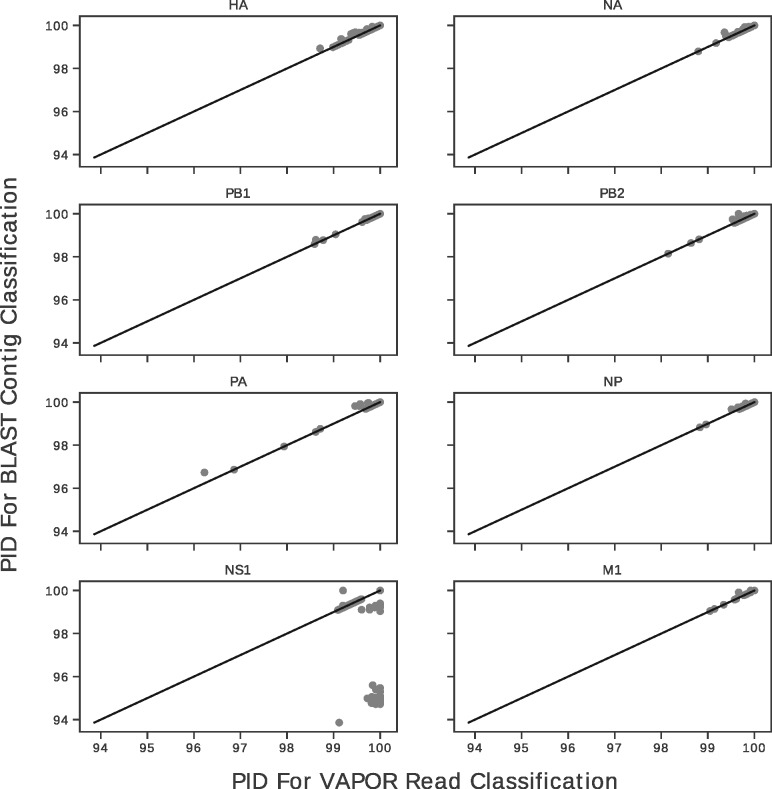
Fig. 5.
Scatterplots showing PIDs of VAPOR read classifications versus BLAST contig classifications with respect to assembled contigs for all eight major segment coding sequences. Black lines indicate x = y. Points that fall below this line were classified better from reads with VAPOR. Points above the line were classified better with BLAST from contigs. VAPOR is capable in general of performing classification of reads to within 1% of the correct sequence. The mean PID of VAPOR classifications for all segments was 99.82%. For datapoints under 98% PID, BLAST was generally also not able of providing a better classification given the reference database

