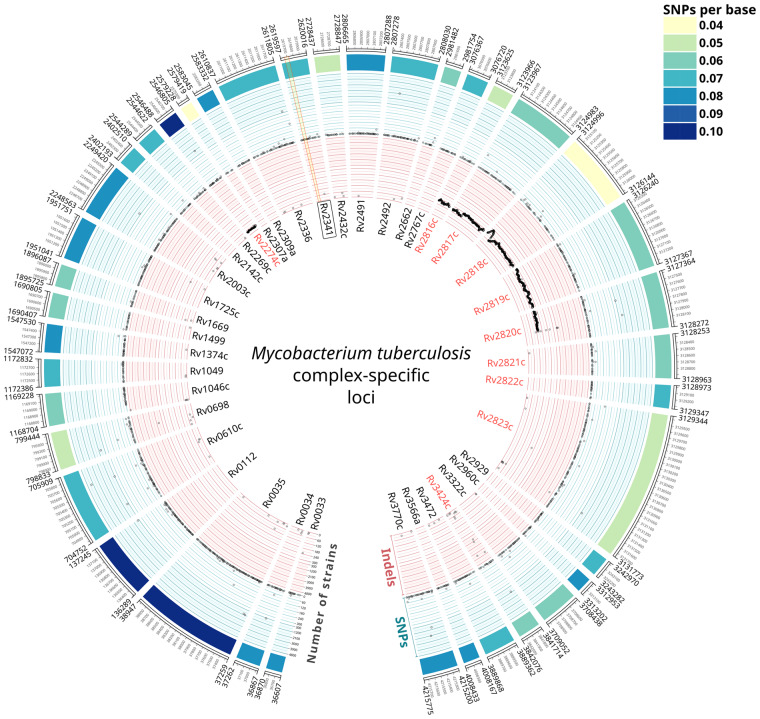
Fig. 1.
The 40 MTBC-specific loci. Gene names in red indicate the 10 loci that were discarded as diagnostic markers for being within RD (Rv2274c and Rv2816c-2820c), associated to CRISPR (Rv2816c-2823c) or duplicated in the genome (Rv3424c). Concentric circles represent different genetic diversity metrics. Outer heatmap: number of SNPs per base. Blue circle: prevalence of each SNP of each gene across the database of MTBC strains. Inner, red circle: prevalence of each indel of each gene across the database of MTBC strains. Note that both inner circles have two scales, one from 0 to 300 strains and other from 300 to 4800 strains. The region of the Rv2341 gene amplified in our qPCR assay is indicated in light yellow. RD 182 and 207 are clearly detected in our analysis, indicated as contiguous deleted regions in a high number of strains.

