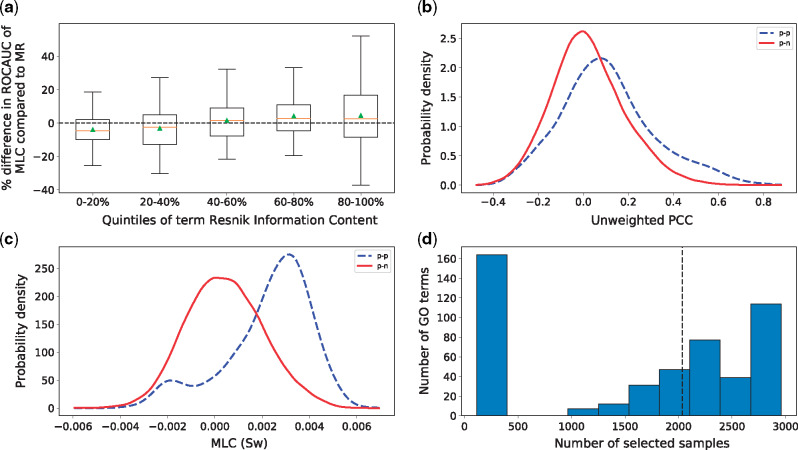
Fig. 2.
(a) Percent increase in ROCAUC of MLC (Sw) with respect to MR as a function of Resnik IC. For each set of terms in each quintile of IC, the corresponding box includes the two middle quartiles of the percent increase for these terms. An orange line denotes the median and a green triangle the mean. The error bars extend to 1.5 times the range of the two middle quartiles. Note, that the 0–20% quintile corresponds to the 20% least specific terms and the 80–100% quintile to the 20% most specific ones. (b–c) Distributions of co-expressions for genes annotated with term GO: 1903047. In dashed blue lines, the co-expression values between a test and a training gene that both are annotated with that term. In solid red lines, the co-expression between test genes annotated with that GO term and training genes that are not. Co-expression is measured as the PCC (b) and the Sw trained by MLC (c). The x-axis shows the co-expression values and the y-axis the probability density estimated with Gaussian kernels. Note that the PCC and Sw have different ranges due to the weight optimization. (d) Histogram of the number of samples that were selected for each GO term. The x-axis corresponds to the number of selected samples and the y-axis to how many GO-term-specific similarity functions selected that many samples. The dashed line denotes the median number of non-zero weights

