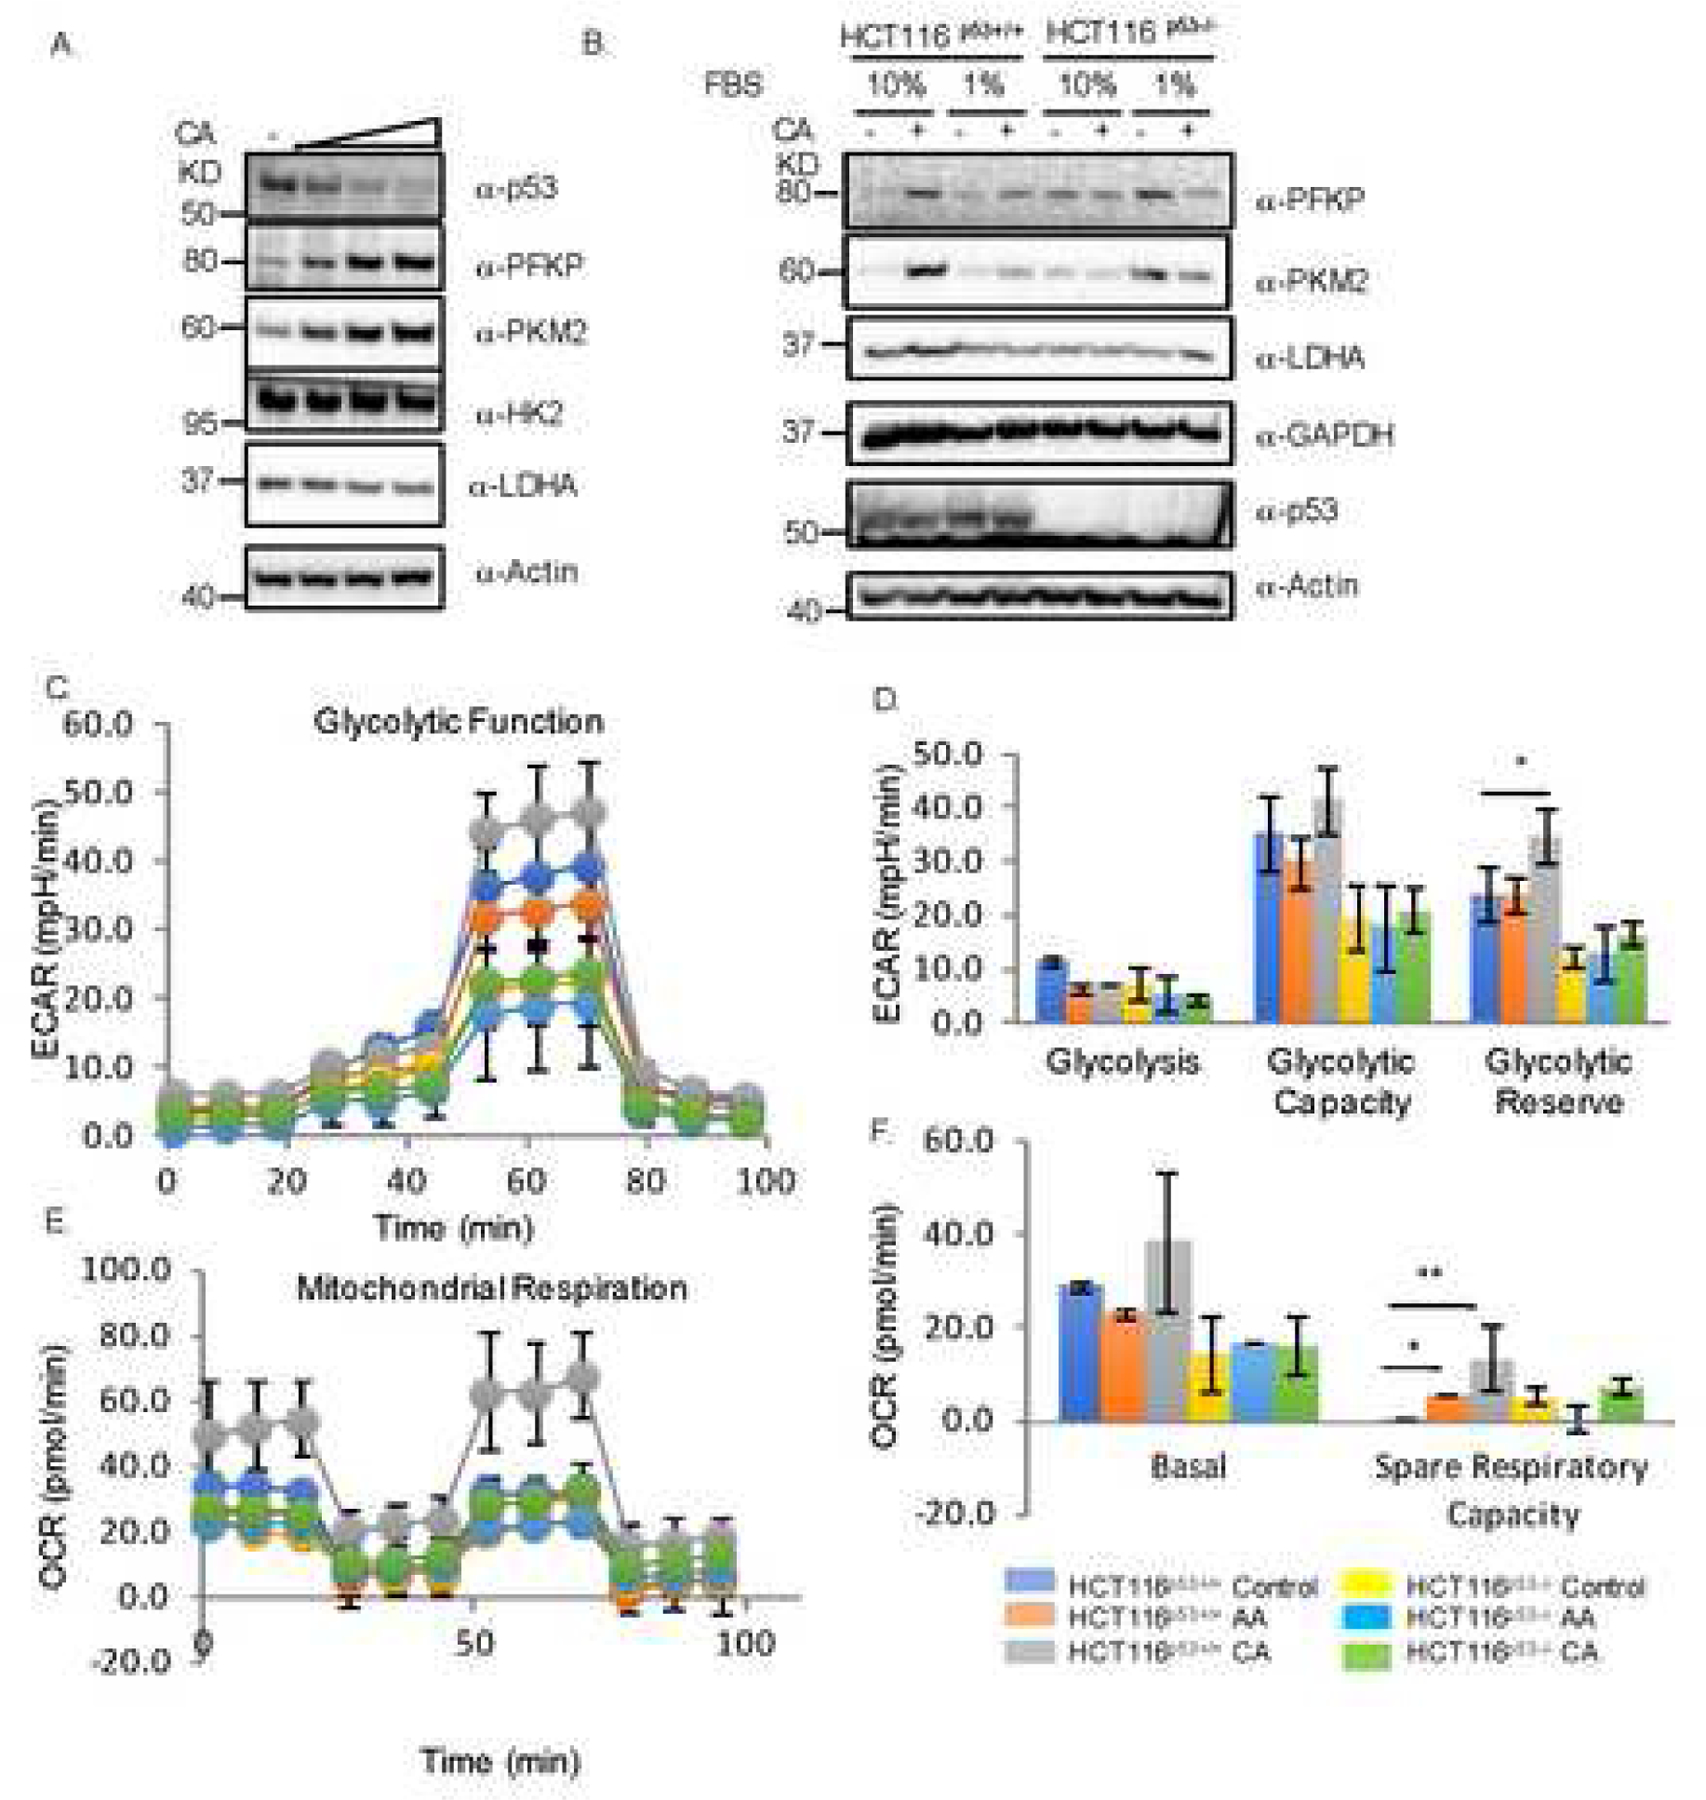
Fig. 3. Crotonic acid increases glycolysis, and elevates cancer cell growth dependently of p53 in response to nutrition depletion.

(A) CA reduces p53 level, but increases the level of PKFP and PKM2. MCF7 cells were treated with different doses of CA (2,5 and 10mM) for 4 days and harvested for IB analysis with indicated antibodies. (B) CA and serum starvation reduce p53 level, induction of PKFP and PKM2 by CA is p53-dependent. T116p53+/+ or HCT116p53−/− cells were cultured in media containing either 10% or 1% FBS in the presence or absence of 2mM of CA for 48h and harvested for IB with indicated antibodies. (C) p53-dependence of increase of extracellular acidification rate (ECAR) by CA. HCT116p53+/+ or HCT116p53−/− cells were treated with CA (Cro) or AA (Ace) for 24h and analyzed by using the Agilent Seahorse XF Analyzers to measure ECAR after sequential treatment with glucose (Glc), oligomycin (O) and 20DG. The quantification is shown in the graph below. (D) p53-dependence of increase of oxygen consumption rate (OCR) by CA. The same treatment as that in panel C was done and followed by sequential treatment with oligomycin (o), FCCP, and rotenone plus antimycin (R+A) for OCA analysis by the Seahorse Analyzers. The quantification is shown in the right graph.
