
Figure 2.
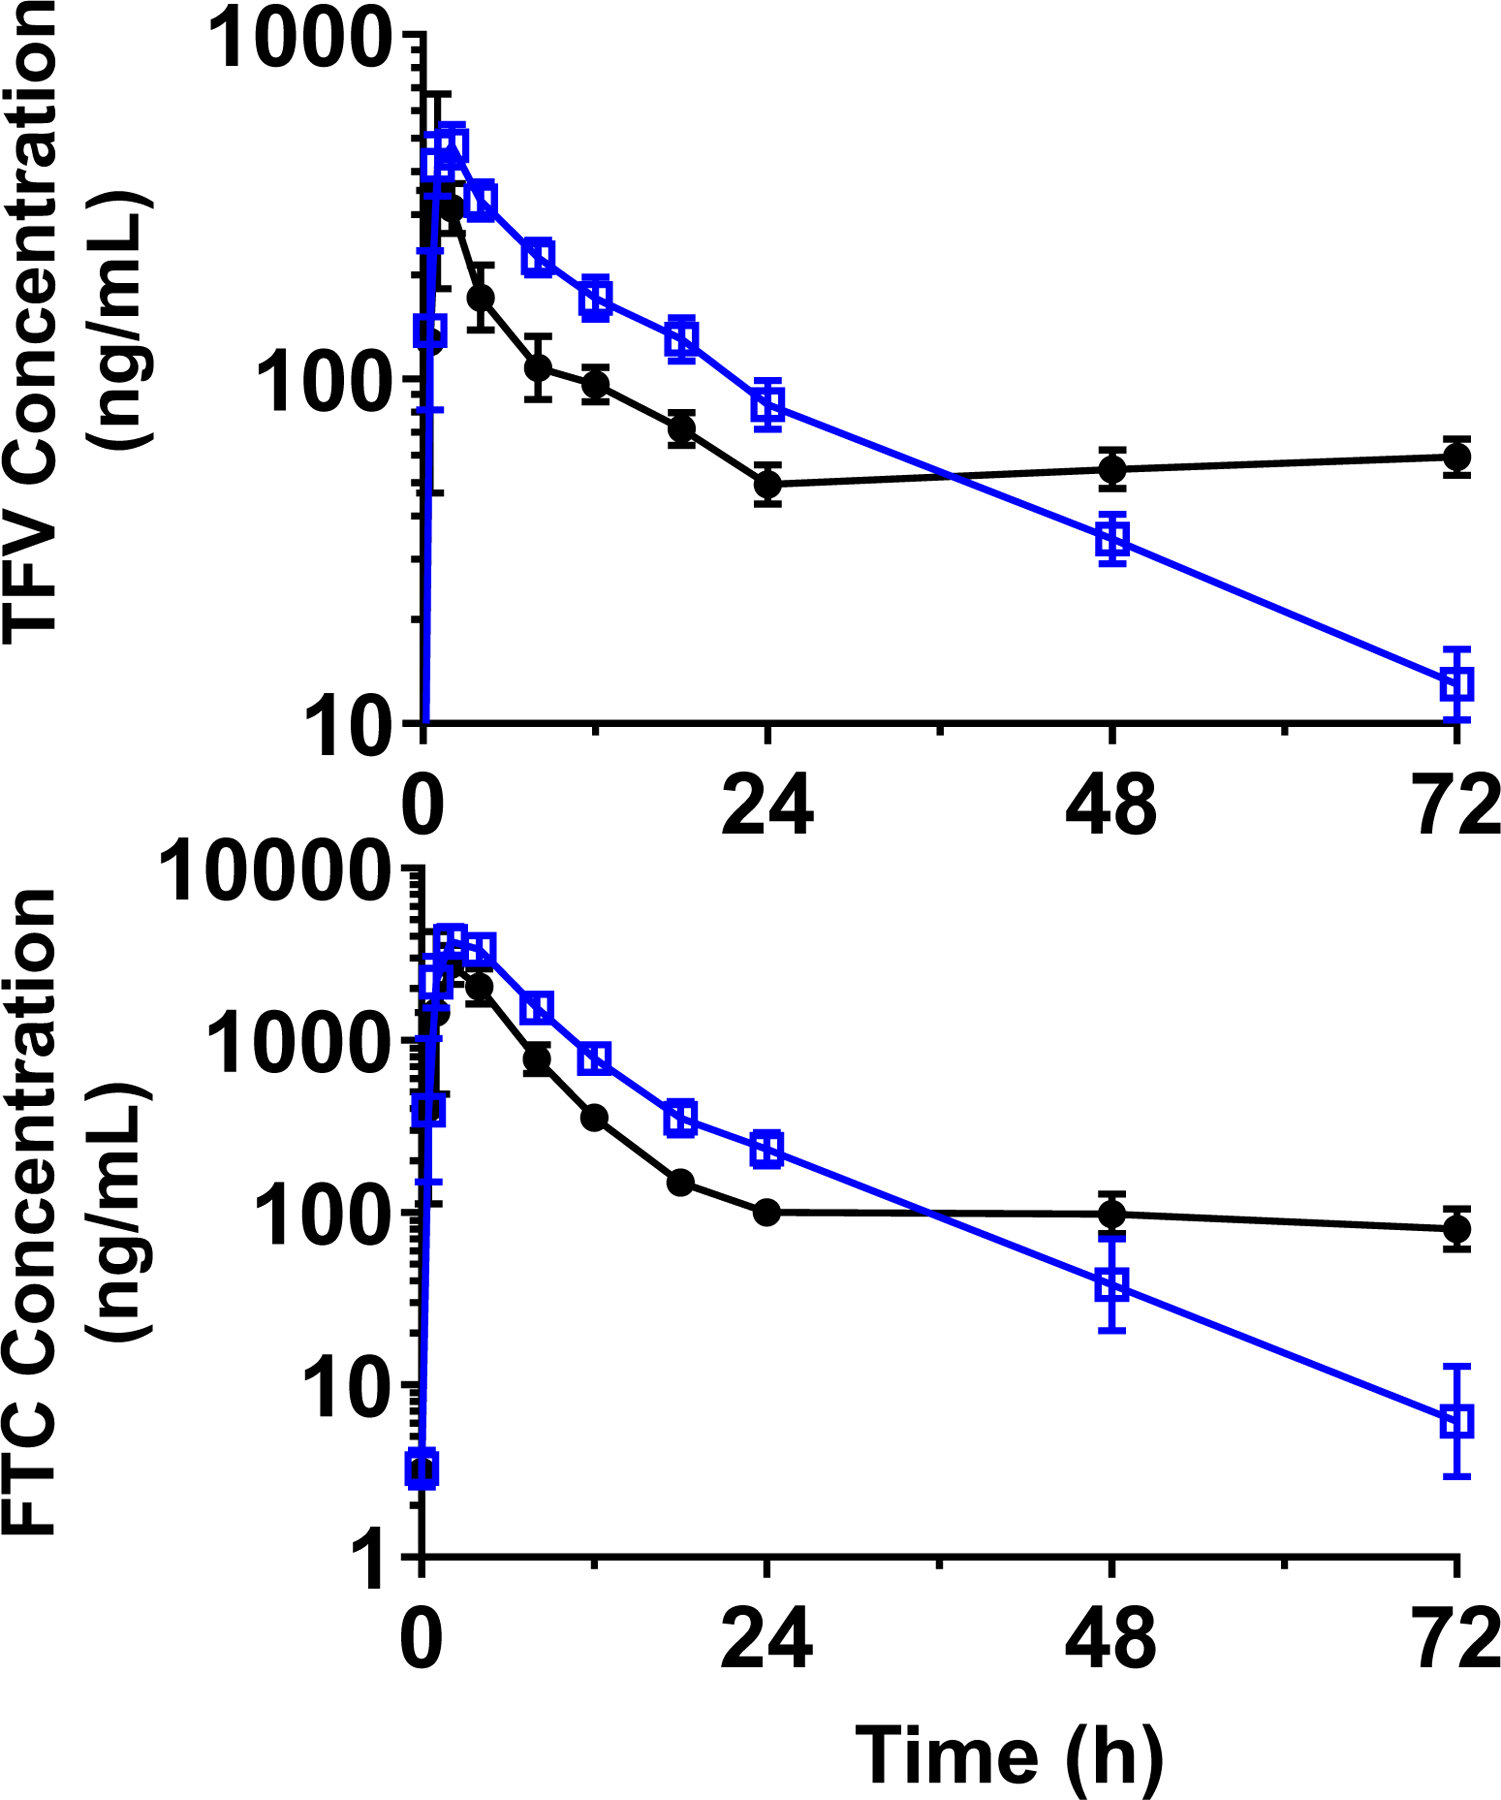
GM and 95% CI for plasma concentration-time profiles for TFV (top) and FTC (bottom) concentrations for the T +PRO (open blue squares) and C IPERGAY (closed black circles) treatments.
Official websites use .gov
A
.gov website belongs to an official
government organization in the United States.
Secure .gov websites use HTTPS
A lock (
) or https:// means you've safely
connected to the .gov website. Share sensitive
information only on official, secure websites.
GM and 95% CI for plasma concentration-time profiles for TFV (top) and FTC (bottom) concentrations for the T +PRO (open blue squares) and C IPERGAY (closed black circles) treatments.