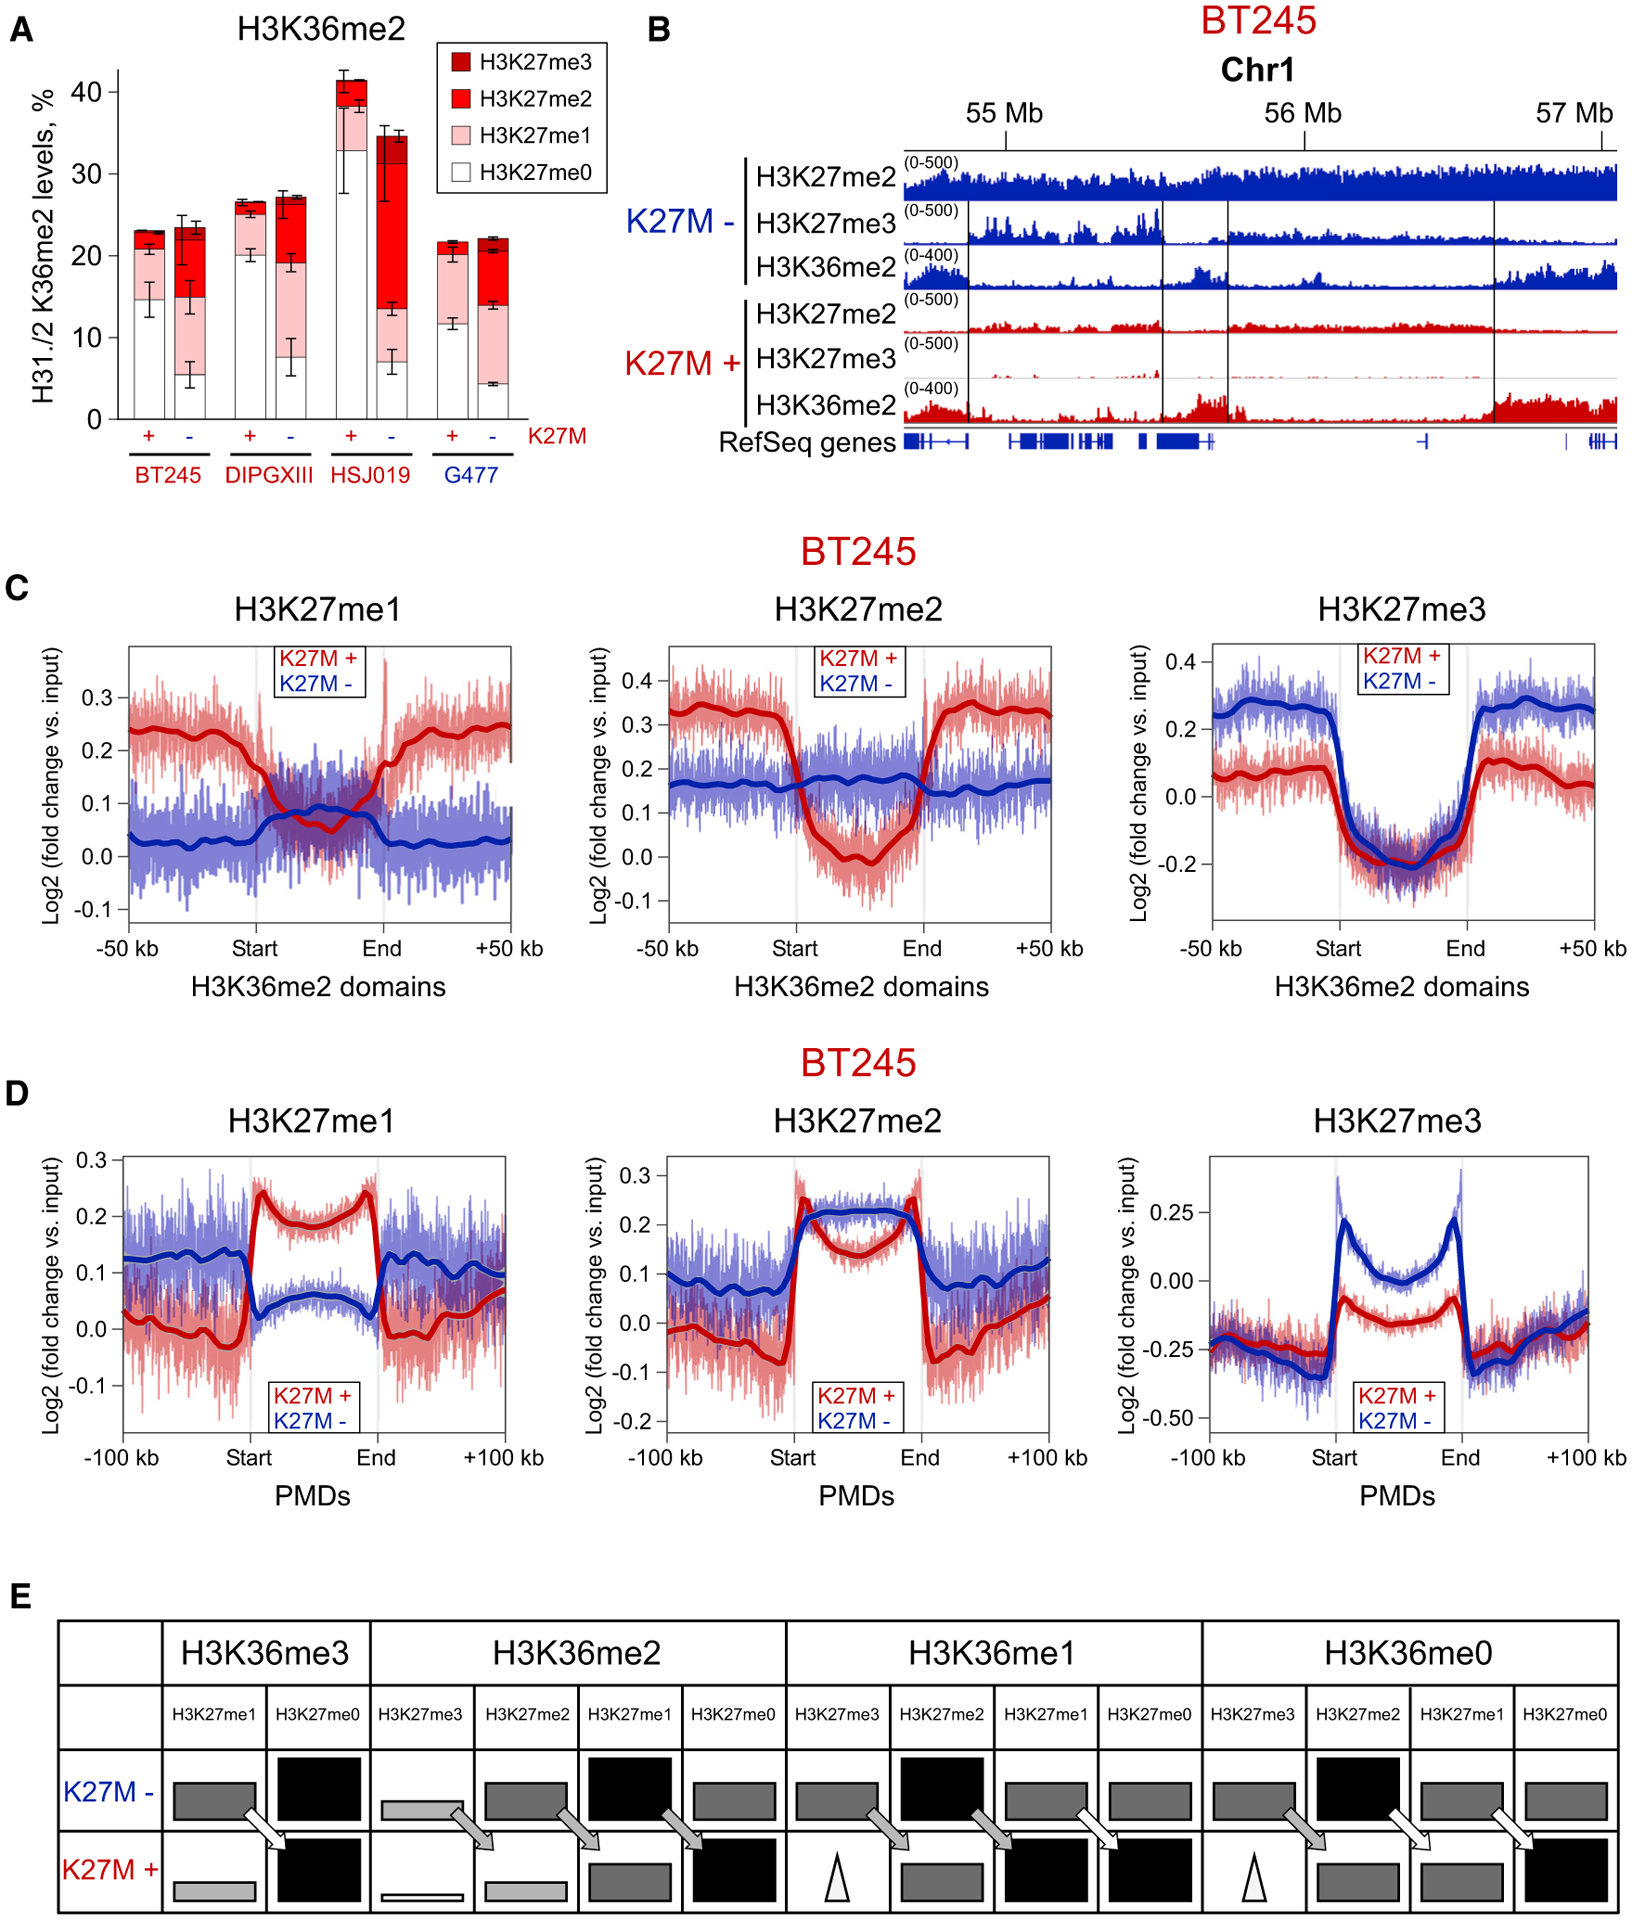
Figure 2. H3K36me2 Forms Boundaries for H3K27me3 in WT and for H3K27me2 in K27M.

(A) Combinatorial mass spectrometry showing a large increase in the co-occurrence of H3K27me2/H3K36me2 after removal of H3.3K27M. Bars heights indicate the levels of the H3K36me2 mark, and differently colored sections indicate the proportion of H3K36me2 combination with H3K27me marks. Data from four isogenic cell lines; means ± SD for each mark combination, n ≥ 3 replicates.
(B) ChIP-seq signal showing alternating H3K36me2/H3K27me3 domains in K27M−, corresponding to alternating H3K36me2/K27me2 domains in K27M+ in BT245 cell line. We do not observe large-scale changes in the H3K36me2 distribution, suggesting that removal of the H3.3K27M mutation and subsequent spread of H3K27me3 does not displace H3K36me2.
(C) Aggregated signal of H3K27me1/2/3 over the intergenic H3K36me2 domains in the BT245 cell line. Domains containing active genes have been removed to exclude the effect of H3K36me3. In the K27M+, all H3K27 methylation levels are excluded from the H3K36me2 domains, whereas, in K27M−, only H3K27me3 is excluded, and H3K27me1 is slightly elevated because of its lack of conversion into the higher levels. Domains overlapping with H3K36me3 have been removed to exclude its effect.
(D) Aggregated signal of H3K27me1/2/3 over partially methylated domains (PMDs) in the BT245 cell line. PMD domains represent the most permissive regions for the spread of H3K27 methylation in both conditions. H3K27me1 levels are higher in PMDs in K27M+ condition, whereas H3K27me3 is depleted, compared with K27M−. H3K27me2 is depleted at the central part of PMDs, being retained at the edges.
(E) Schematic illustration of the patterns of H3K27 methylation marks in H3K36me0/1/2/3-enriched regions, with K27M+ or without K27M−. The schema is derived from mass spectrometry data. Darker and bigger rectangles indicate higher levels of the respective histone mark in broad domains. Triangles denote narrow peaks of H3K27me3 across the regions (at unmethylated CGIs). The arrows show the one-step reduction of H3K27me marks in K27M+.
