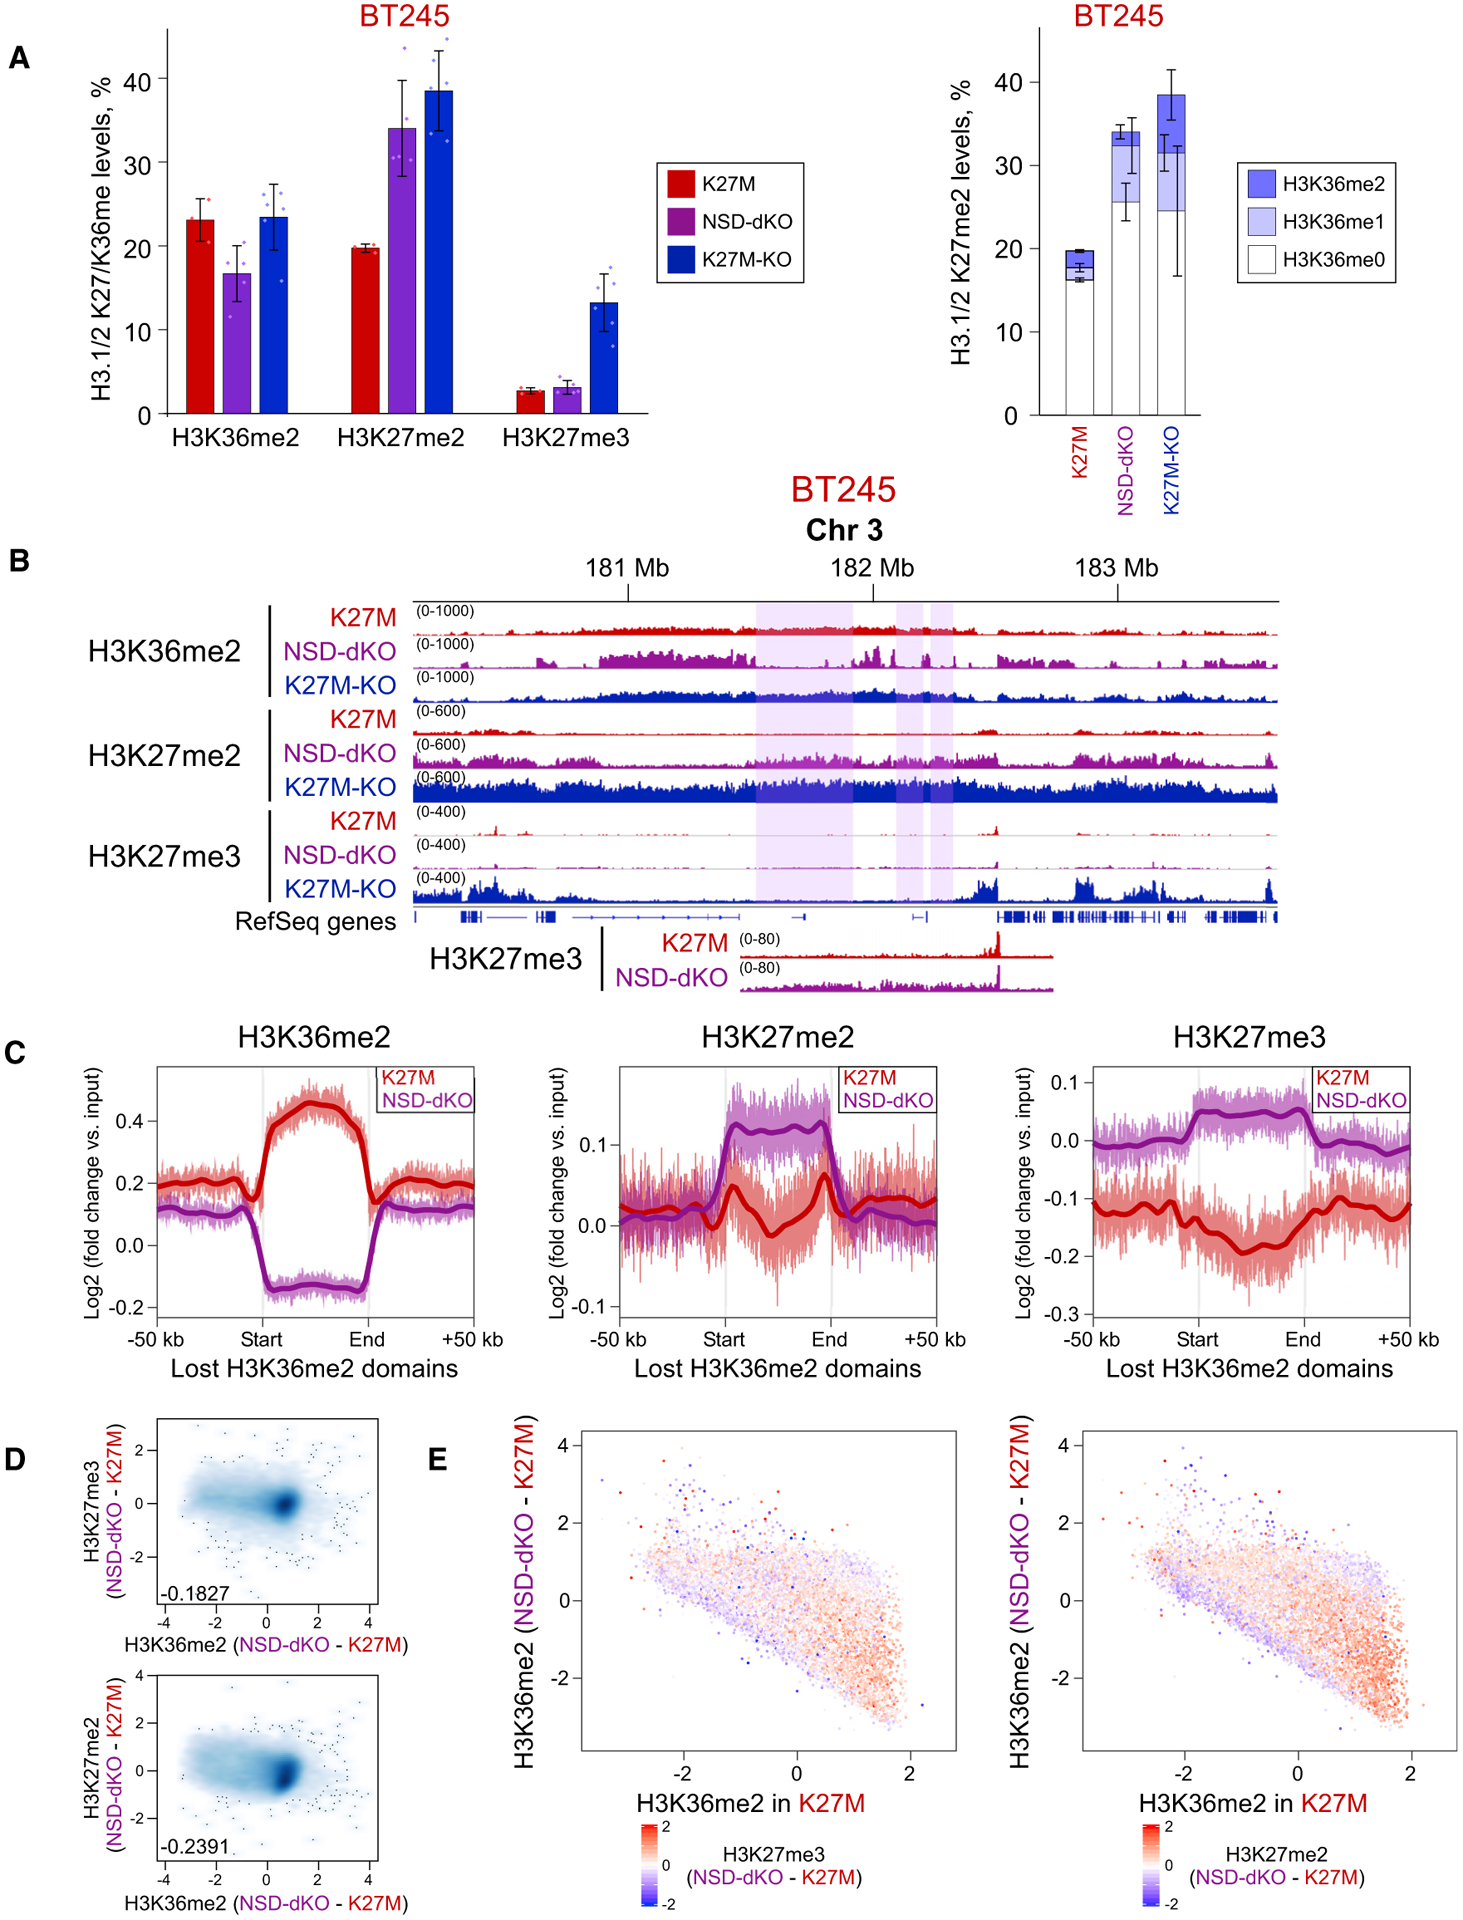
Figure 3. Depletion of H3K36me2 Domains Allows Increase of H3K27me2/3.

(A) Mass spectrometry shows increase of H3K27me2 (left panel) and its increased co-occurrence with H3K36me0/1 (right panel), reflecting its spread into regions that lose H3K36me2. In the right panel, H3K27me2 is shown in combination with H3K36me0/1/2 (increasingly dark color). Means ± SD (for each bar section on the right), n ≥ 3 replicates. Dots show individual replicate values.
(B) ChIP-seq data of BT245 cell line showing H3K27me2/3 spreading into the regions of H3K36me2 loss. Highlighted regions illustrate domains of H3K36me2 loss. The region is shown at a different scale at the bottom, to visualize the low-level increase in H3K27me3.
(C) Aggregate signal of H3K36me2, H3K27me2/3 in the regions of H3K36me2 loss shows an increase of H3K27me2 and a subtler increase in H3K27me3.
(D) Correlation of H3K27me2/3 with H3K36me2 levels in 100-kb bins in BT245. Genome-wide loss of H3K36me2 in NSD1/2-DKO correlates with gains of H3K27me2/3.
(E) H3K36me2 signal change in genome-wide 100-kb bins of BT245 and NSD1/2-dKO (first clone); color is coded by H3K27me3 (left panel) and H3K27me2 (right panel) levels. The y axis shows the difference in H3K36me2 levels in K27M versus NSD1/2-dKO (log2), whereas x axis shows H3K36me2 levels in K27M. Regions with largest loss of H3K36me2 experience the highest gain of H3K27me2/3 (bottom right).
