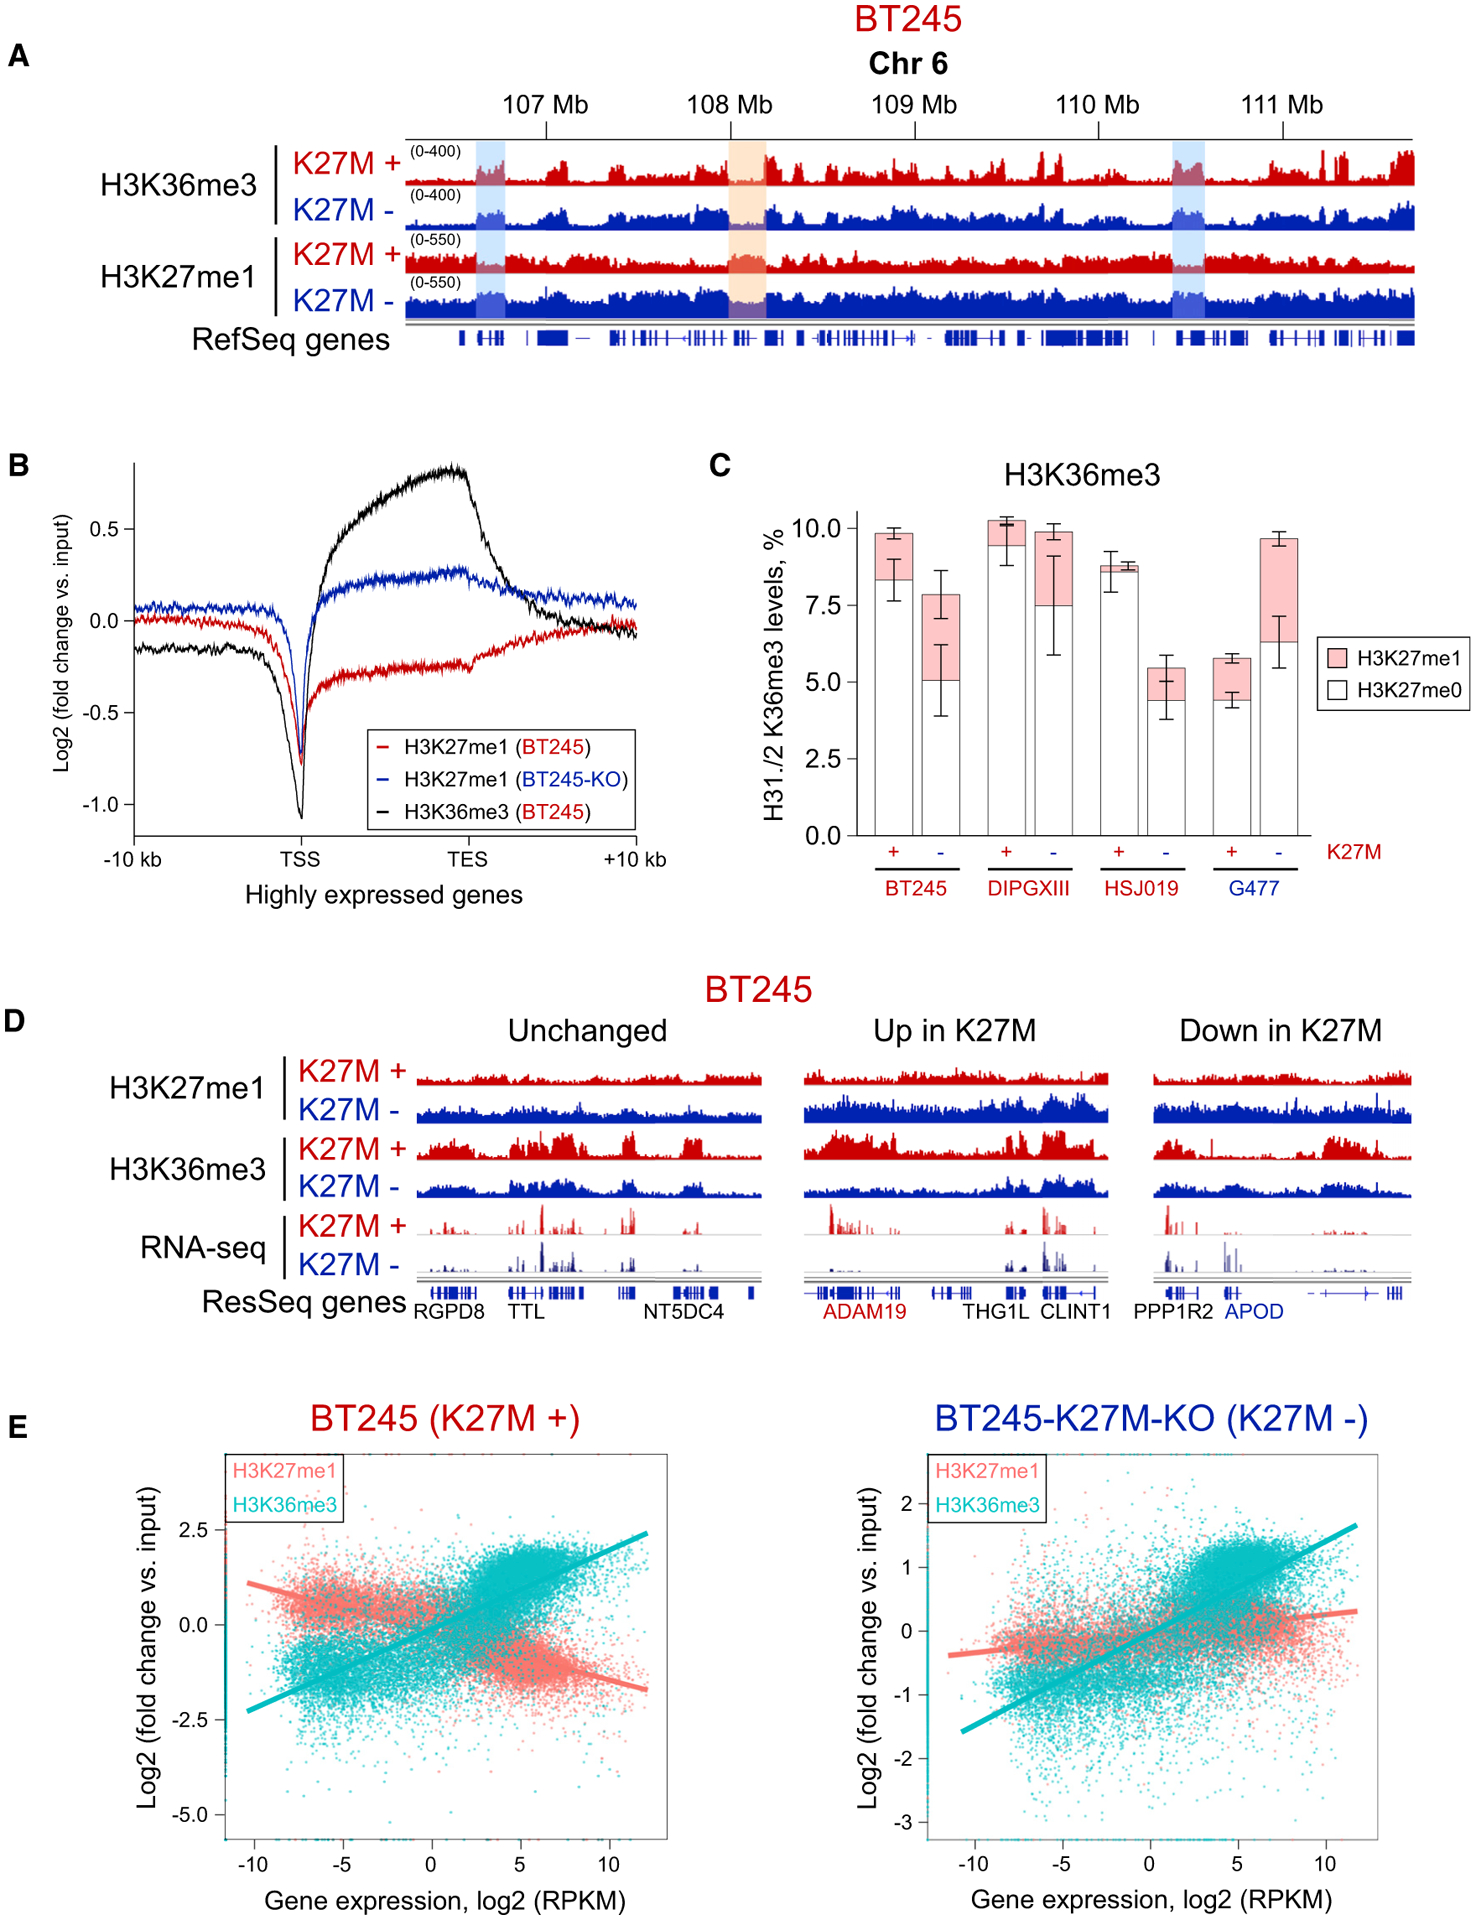
Figure 4. H3K27me1 Association with H3K36me3 and Gene Expression Is Absent in H3.3 K27M Samples.

(A) ChIP-seq tracks of BT245 isogenic cell line showing H3K27me1 domains co-occurring with H3K36me3 in K27M−, whereas, in K27M+, H3K27me1 is mainly depleted in H3K36me3-rich regions. No major changes for H3K36me3 are observed.
(B) Aggregate plots of H3K27me1 overexpressed genic regions, showing higher enrichment in K27M− cells.
(C) Histone mass spectrometry showing changes in H3K36me3-H3K27me1 combinatorial mark in K27M− and K27M+ conditions. Means ± SD (for each bar section), n ≥ 3 replicates.
(D) Comparison of H3K27me1, H3K36me3, and gene expression (RNA-seq) for representative examples of unchanged, upregulated, and downregulated genes.
(E) Correlation plots of H3K27me1 and H3K36me3 signal with gene expression of respective genes in K27M− and K27M+ conditions. Although H3K36me3 levels positively correlate with gene expression in both conditions, H3K27me1 levels show mild positive correlation in K27M− condition and is negatively correlated with gene expression in K27M+ cells.
