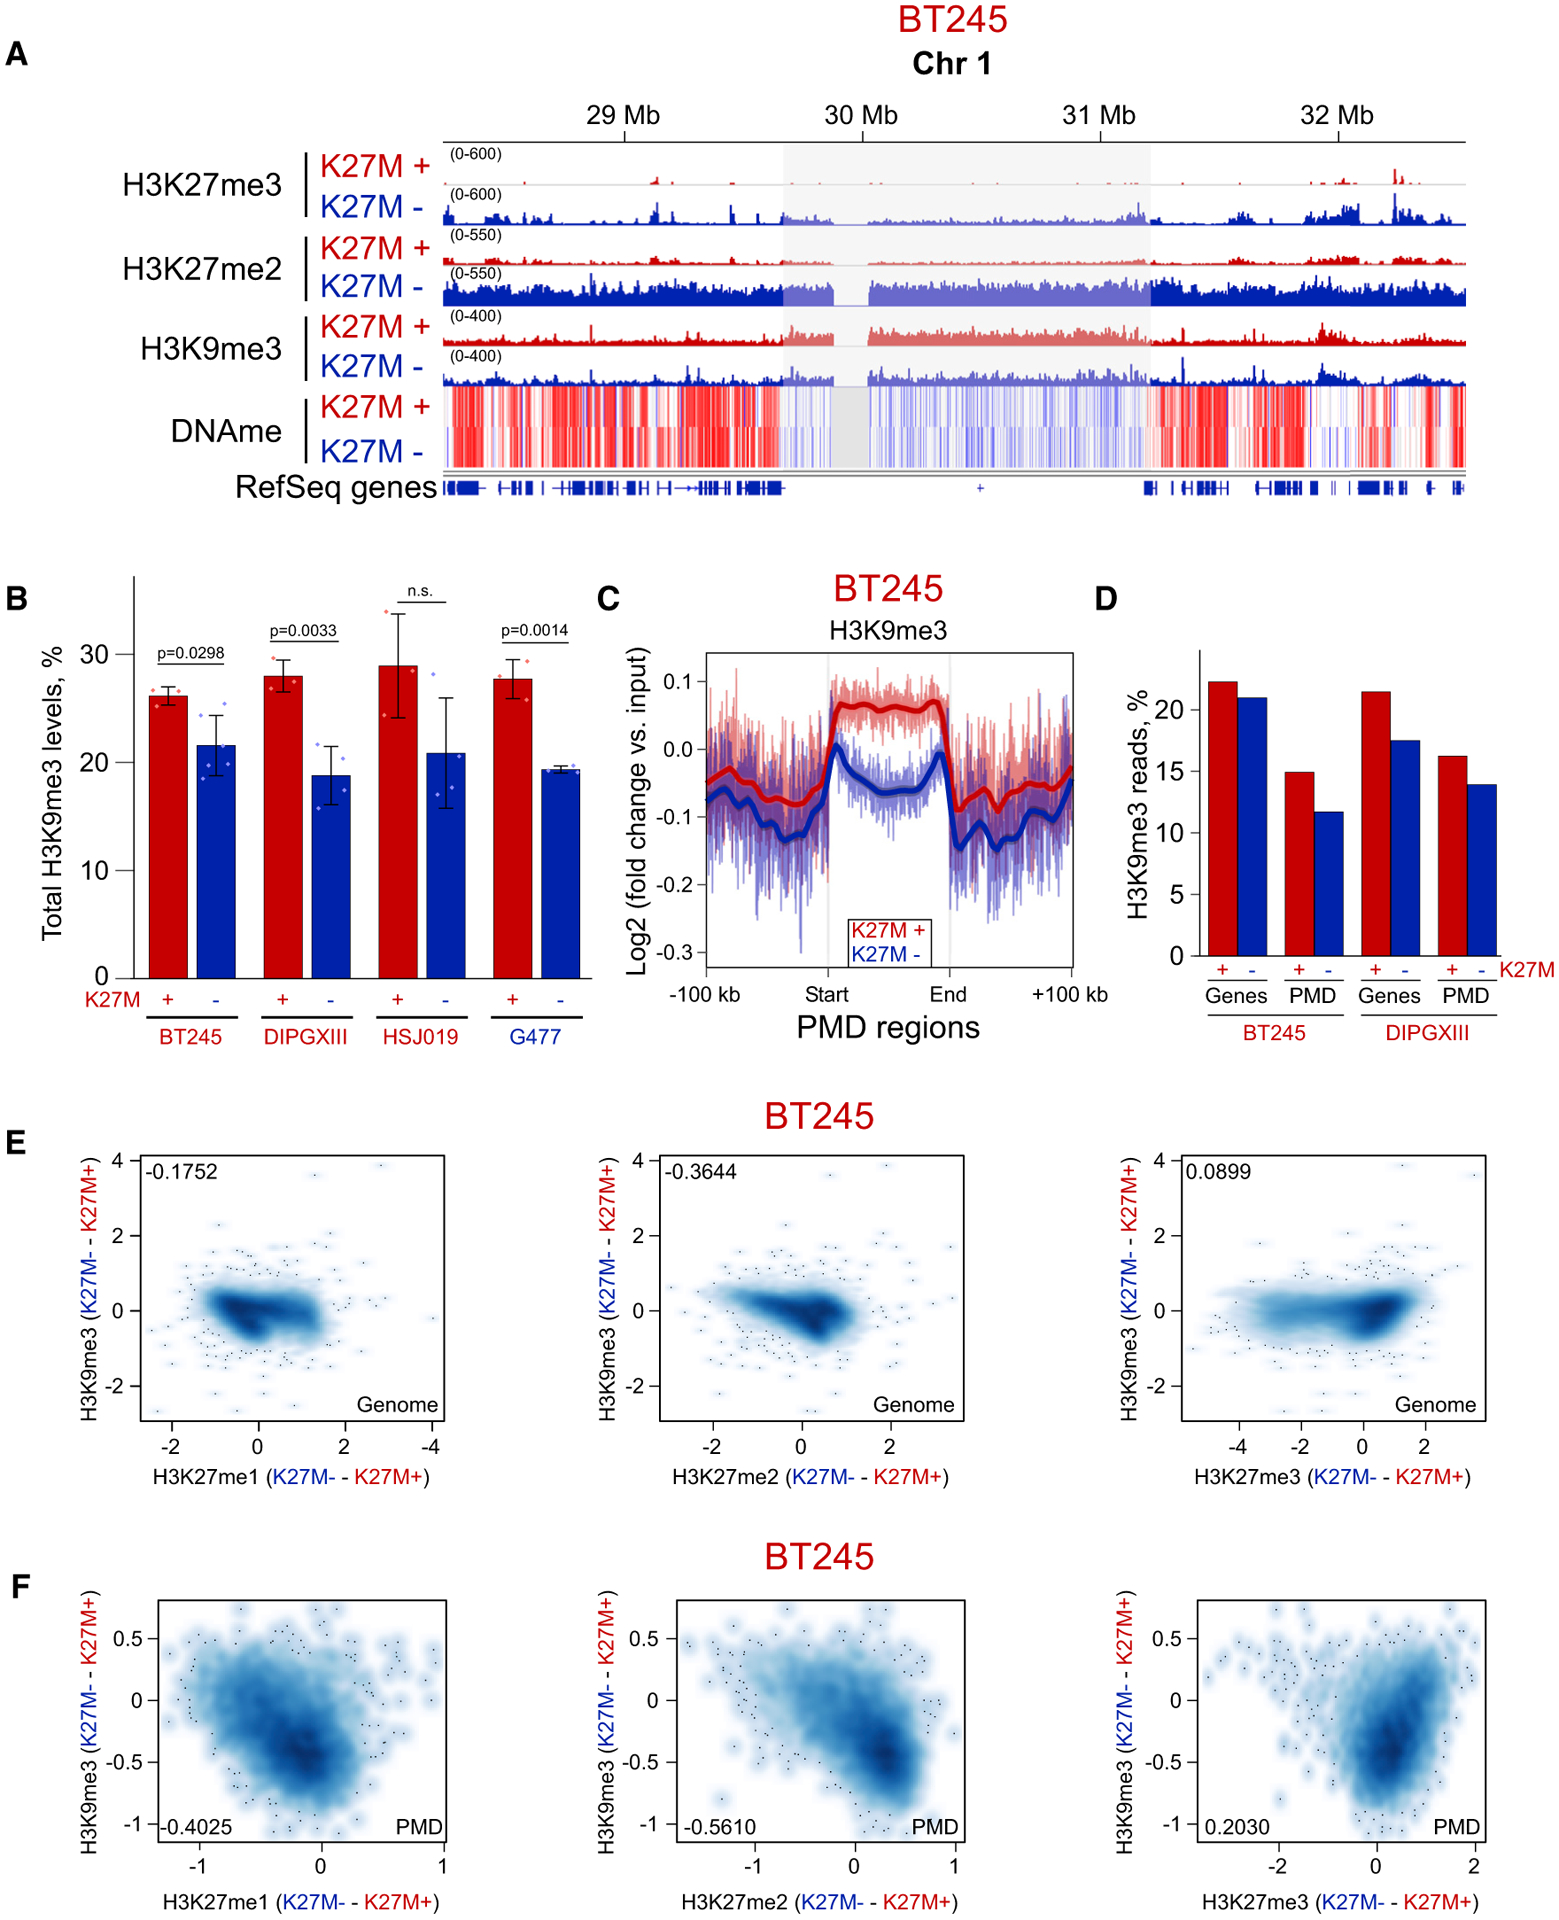
Figure 5. Moderate H3K9me3 Increase in Domains Losing H3K27me2/3 in H3.3 K27M.

(A) ChIP-seq and whole-genome bisulphite sequencing tracks of BT245 cell line showing H3K9me3 enrichment in some H3K27me2-depleted PMDs.
(B) Histone mass spectrometry showing higher levels of H3K9me3 in K27M+ cell lines and its reduction in K27M−. Data from four cell lines; means ± SD, n ≥ 3 replicates, Student’s t test. Dots show individual replicate values.
(C) Aggregate plots of H3K9me3 over PMD domains, summarizing the observed changes on ChIP-seq tracks.
(D) Proportion of H3K9me3 reads is decreased both in PMD regions and in genes in K27M−.
(E and F) Correlation plots of H3K9me3 change with changes in H3K27me1/2/3 marks genome wide (E) and in PMD regions (F). Axis scales are log2 (ChIP versus input), darker color indicates a higher density of bins. Pearson correlation coefficients are shown in the corners of the plots.
