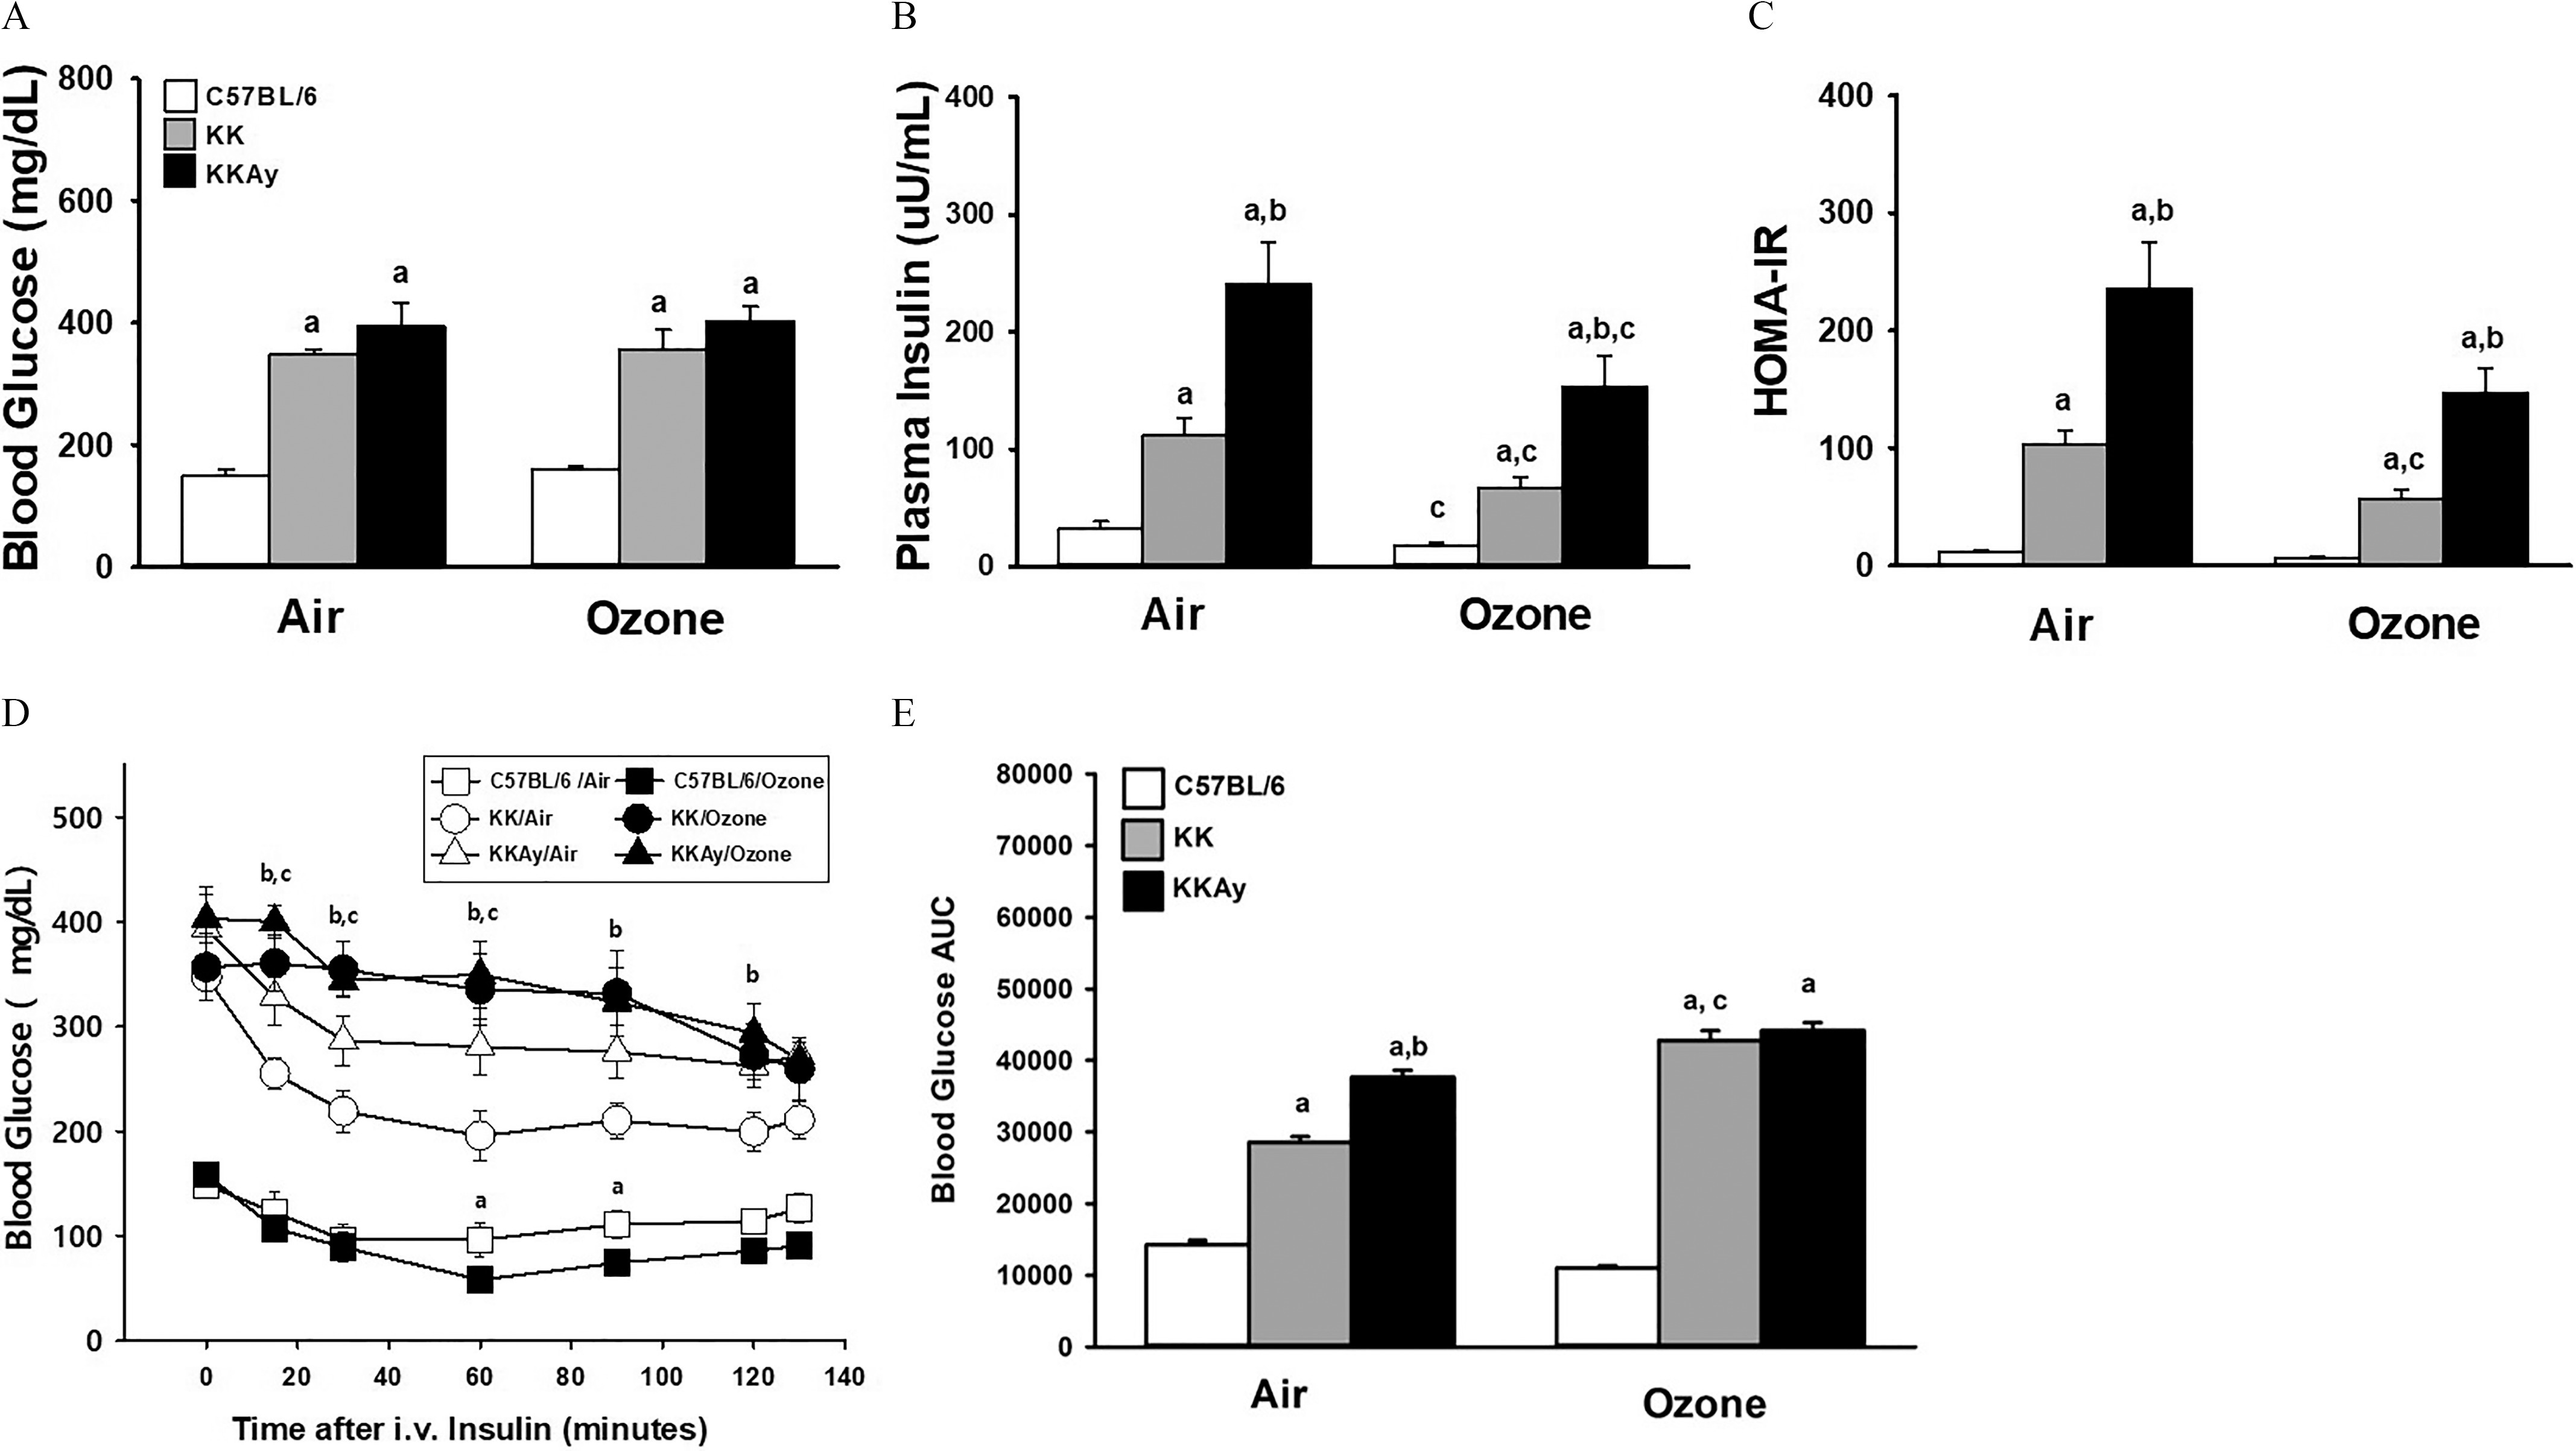
Figure 1.

Serum glucose and insulin in fasted mice and following an insulin tolerance test (ITT) in C57BL/6J, KK and KKAy mice after air or exposure for 13 d. Plasma concentrations of glucose (A) and insulin (B) were measured from fasted all mice at the time of necropsy, approximately 22 h after the last exposure. Data of plasma glucose and insulin were used to calculate HOMA-IR (C). Time-dependent changes in blood glucose after a bolus insulin challenge in fasted mice were measured from 15 to 130 min after challenge (D). Effects of exposure within each strain and timepoint were determined. For each experimental group the area under the curve (AUC) was calculated between 0 to 130 min using the trapezoid rule (GraphPad Prism, San Diego, CA) (E). Data are expressed as (). For Figure 1D: (a) shows significant difference between air- and -exposed C57BL/6 mice; (b) shows significant difference between air- and -exposed KK mice. (c) shows significant difference between air- and -exposed KKAy mice. For remaining figures: (a) significantly different from similarly exposed (b) significantly different from similarly exposed KK mice; (c) significantly different from air-exposed mice of the same strain. Note: Significant differences between indicated groups, , were determined using a completely randomized analysis of variance, with factors of time and exposure for the temporal responses in the insulin tolerance test, and with factors of mouse strain and exposure for remaining data. Comparisons of group means were made with the Student–Newman–Keuls post hoc test. Summary data for panels A, B, C, D, and E can be found in Tables S4, S5, S6, S9, and S10, respectively.
