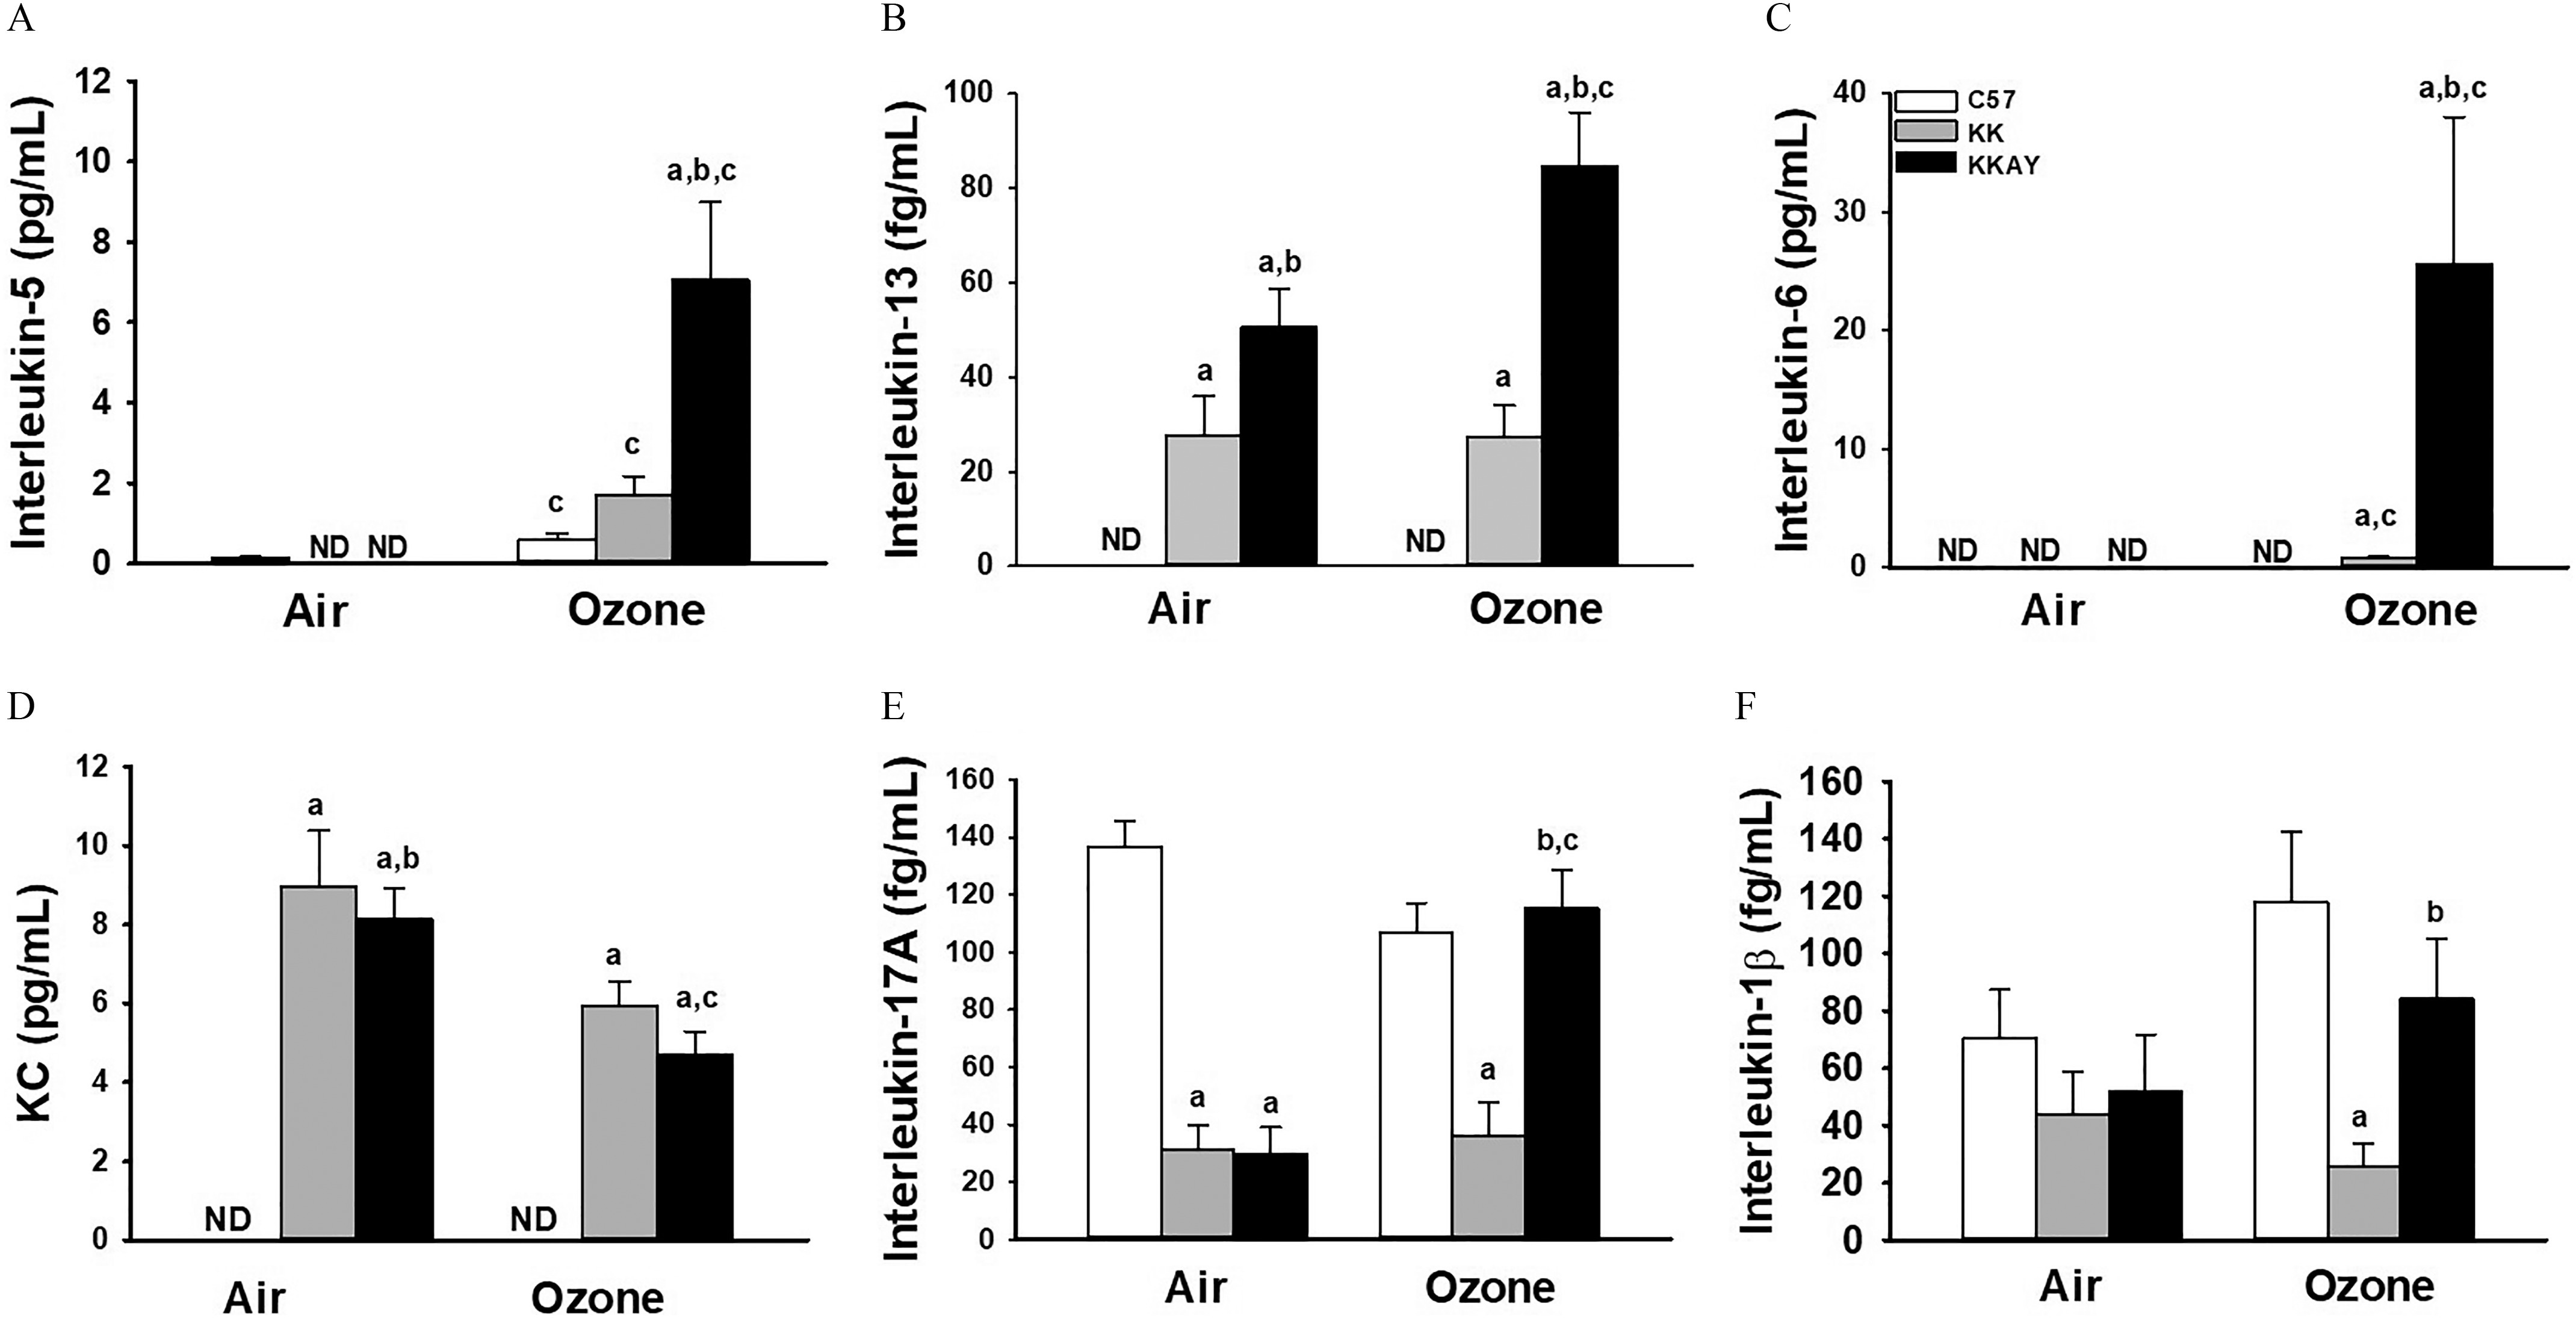
Figure 3.

BALF cytokines in C57BL/6J, KK and KKAy mice after exposure to air or . Concentration in BALF of interleukin-5 (A), , (B), interleukin-17A (C), and KC (D) were determined by ELISA as described in “Methods.” Data are expressed as (). (a) significantly different from similarly exposed ; (b) significantly different from similarly exposed KK mice; (c) significantly different from air-exposed mice of the same strain; . Note: Data were analyzed using a completely randomized analysis of variance with factors of mouse strain and exposure, and comparisons of group means made with the Student–Newman–Keuls post hoc test. Summary data for panels A, B, C, D, E, and F can be found in Tables S20, S21, S22, S23, S24, and S25, respectively. ND, not detected.
