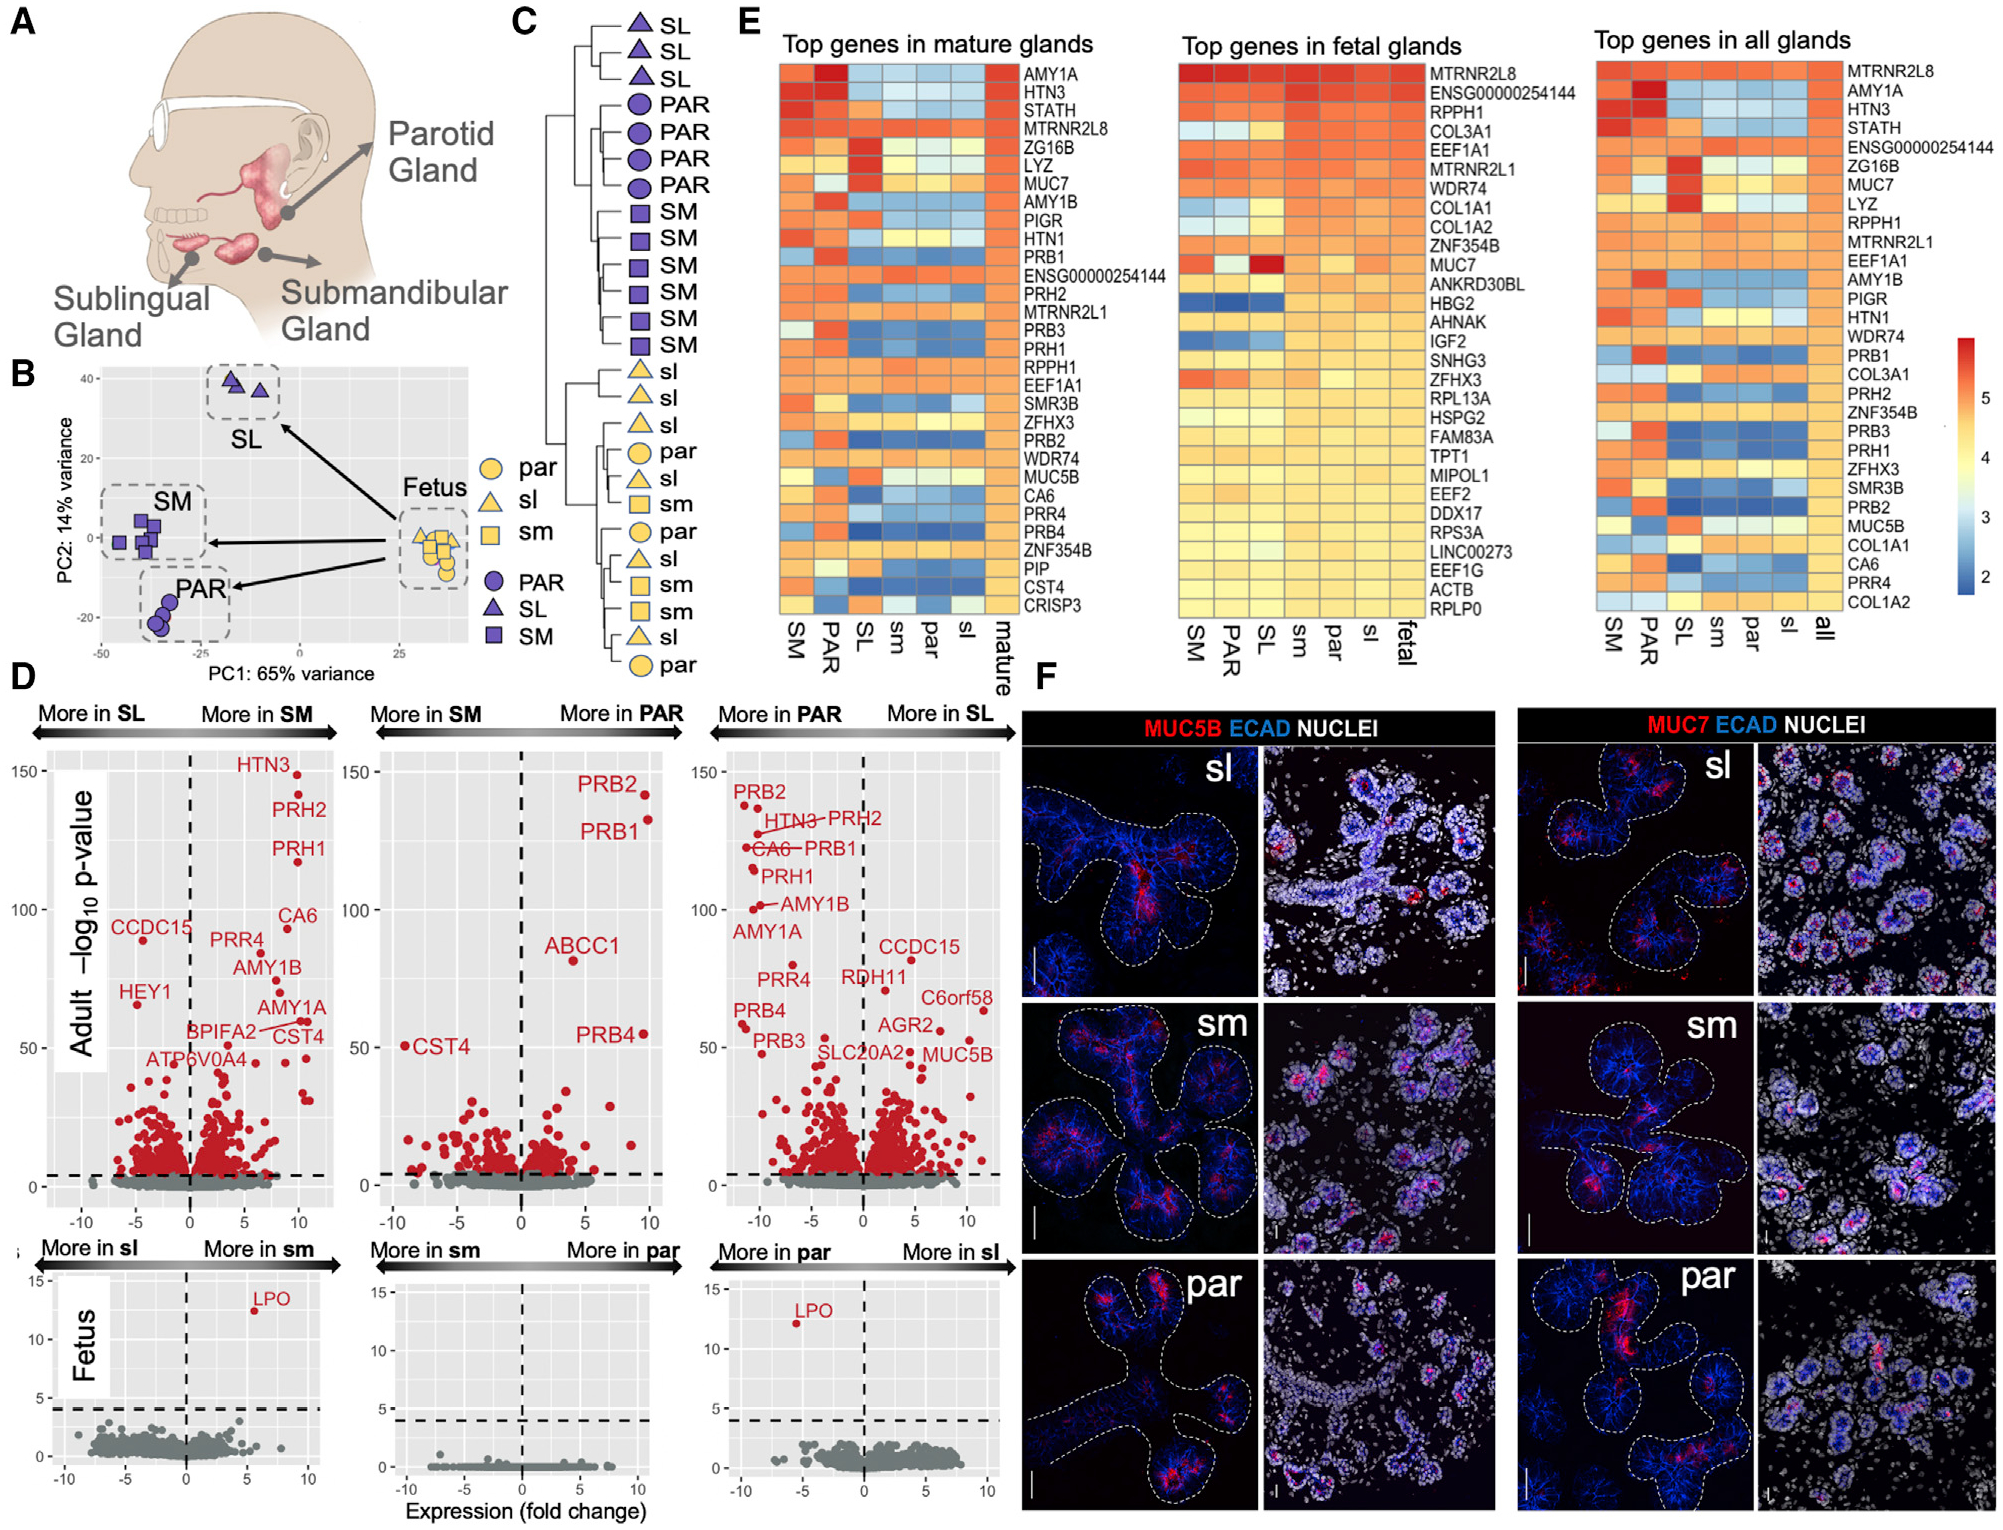
Figure 1. Overview of the Transcriptome Analysis.

(A) Anatomical location of the three major glands in humans.
(B) Principal-component analysis of gene expression levels in adult and fetal salivary glands. Blue symbols, adult samples; yellow symbols, fetal samples. Triangle, square, and circle shapes represent the parotid (PAR), submandibular (SM), and sublingual (SL) glands, respectively (fetal gland types in lowercase letters).
(C) Hierarchical clustering analysis transcriptome data from the different adult and fetal gland types without a priori clustering information.
(D) Volcano plots showing the expression differences among gland types in a pairwise fashion for adult (top) and fetus (bottom). The x axis indicates gene expression log2 fold changes (log2). The y axis indicates a −log10 value of the adjusted p value. Genes with significantly different expressions among glands are indicated in red (adjusted p < 0.0001).
(E) Heatmaps of the log10 normalized expression values of gland-specific genes showing the 30 most highly expressed genes in the different mature and fetal gland types. The top gene, RN7SL1, was excluded because of its role as a housekeeping gene.
(F) Immunofluorescent localization of MUC5B (left panel) and MUC7 (right panel) in fetal glandular tissues. Left-side images of each panel show mucin (red) and E cadherin (blue) immunostaining without nuclei, and right-side images show a lower magnification of the same glandular region and include nuclei. ECAD, E cadherin. Scale bars, 25 μm.
