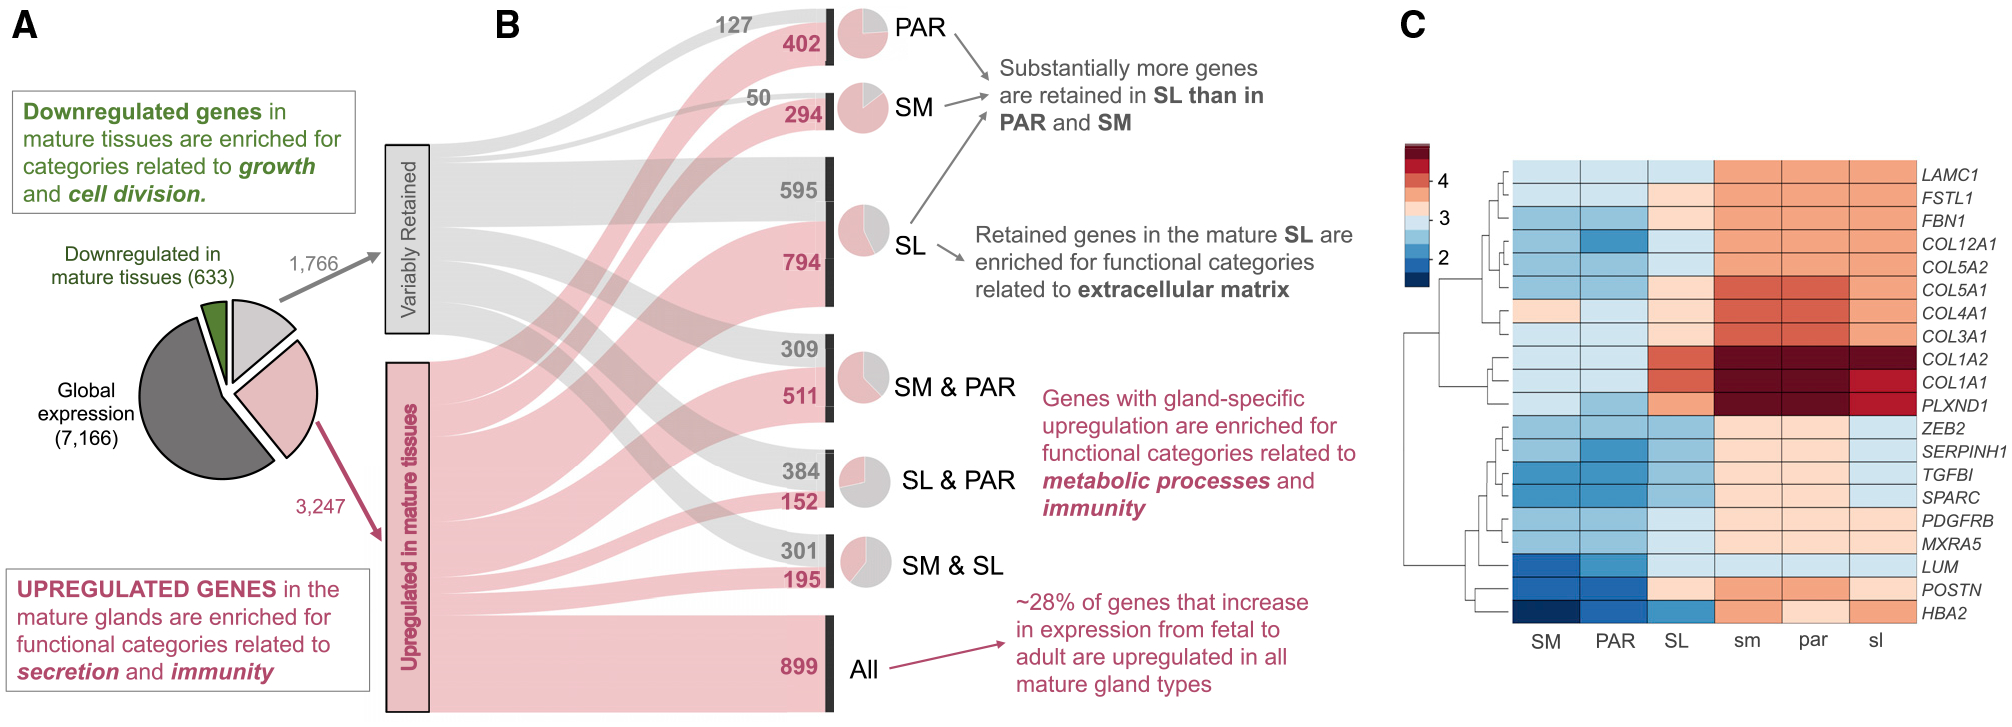
Figure 2. Categorization of Genes Based on Their Expression Trends in Fetal and Mature Salivary Glands.

(A) Pie chart on the left indicates the proportions and numbers of genes (i.e., expressed >100 DESeq2 normalized counts [NCs]) that showed no significant differences (adjusted p > 0.0001, dark gray), were downregulated (adjusted p < 0.0001, green), or were either retained or upregulated in mature salivary glands compared with their fetal counterparts.
(B) Parallel set graph to summarize the breakdown of genes that show variable gene expression in adult glands, indicating how the differential transcriptome repertoires of mature glands are a product of gland-specific retention and upregulation of gene expression. Smaller pie charts at the right side of the parallel set graph indicate the proportion of retained and upregulated genes for each mature gland type.
(C) Heatmap showing genes highly expressed in fetal glands (>1,000 NCs) shown in relative abundance (Z score) that are retained in only one mature gland type from its fetal counterpart, but not in the other two mature gland types.
