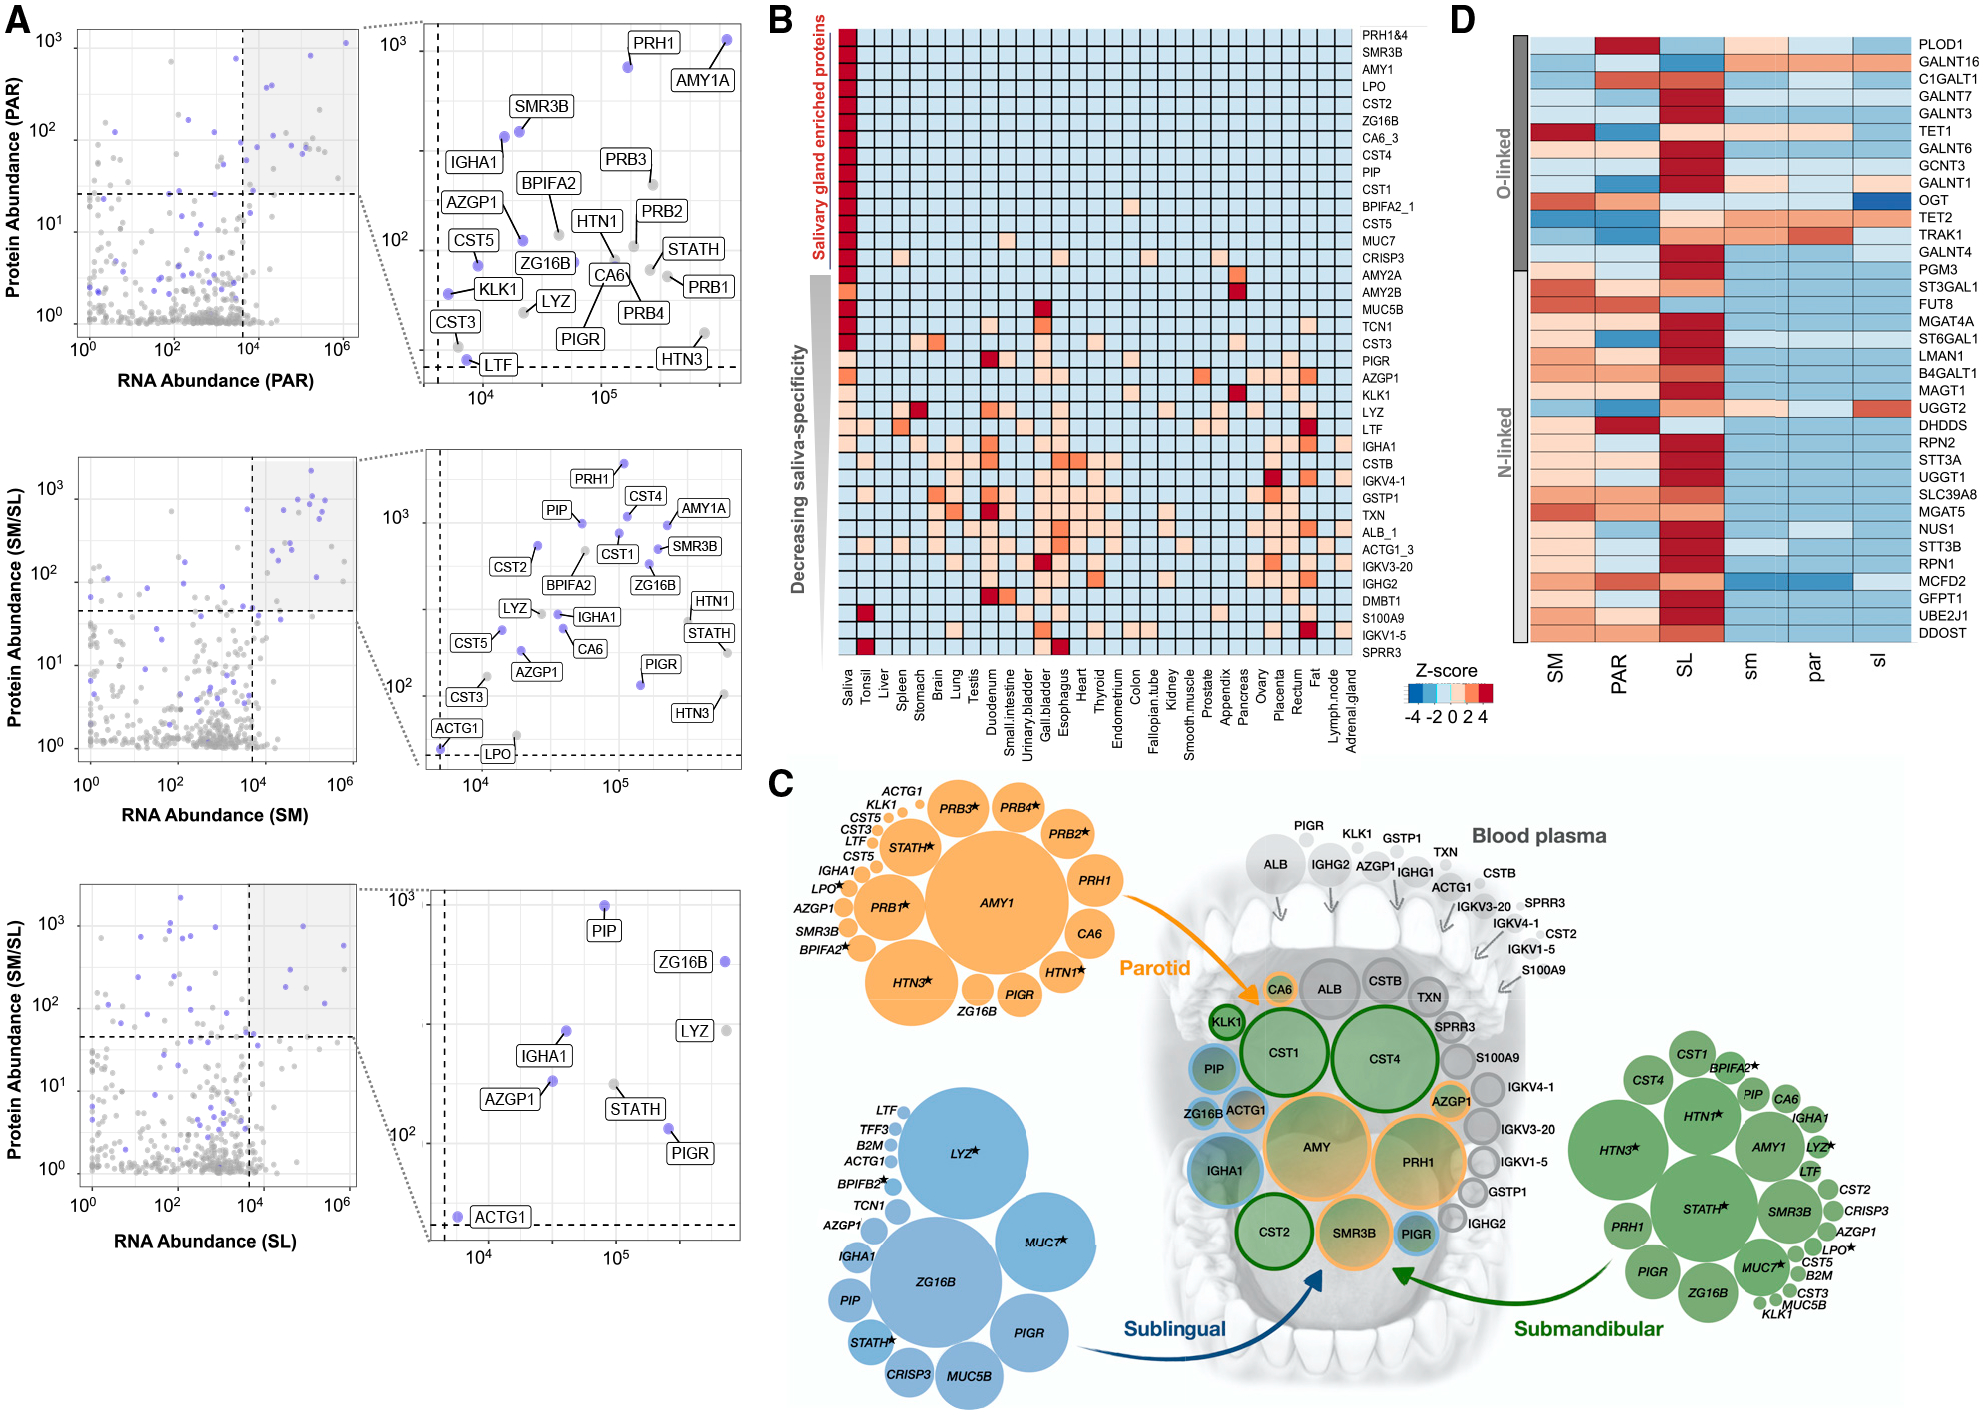
Figure 4. The Shaping of the Salivary Proteome.

(A) Each graph represents a comparison of transcript abundances of a specific gland type, with protein abundances in that gland’s corresponding ductal saliva. x axis, log10 DESeq2 NCs; y axis, log10 normalized protein abundances. Blue dots indicate genes coding for secreted proteins. Genes showing the highest abundance (top 10%) at both the transcript and the protein level are highlighted in the top-right quadrant by a gray background and enlarged in the right panels, with their protein names indicated.
(B) Comparison of the most abundant proteins in human saliva with the protein abundances in 29 human organs from the Human Protein Atlas database (Wang et al., 2019). Genes were chosen based on their protein expression levels, according to the HSP-Wiki database, and their transcript levels, according to our salivary gland RNA-seq analysis. Heatmap colors indicate Z scores normalized for each row of data. Genes are ordered from top (highest) to bottom (lowest) based on their enrichment in salivary glands.
(C) Schematic showing the glandular origins of the most abundant saliva proteins in whole-mouth saliva. The central group of circles represents the most abundant proteins detected in whole-mouth saliva (data source: HSP-Wiki). The groups of circles on the outside represent the transcript levels in the PAR (orange), SL (blue), and SM (green) coding for the most abundant salivary proteins in the corresponding glandular secretions (data source: HSP-Wiki). The sizes (areas) of the circles symbolize relative RNA abundances normalized for each gland type. Colors in the central group of circles indicate the putative salivary gland origin of the proteins or their origin from blood plasma (gray). Blood plasma values are based on protein abundances. Data source: Human Plasma Proteome Project Data Central at PeptideAtlas http://www.peptideatlas.org/hupo/hppp/ (Schwenk et al., 2017). For blood plasma, only those proteins that were abundantly detected in whole-mouth saliva are shown. Proteins, indicated by an asterisk, are detected as secreted proteins at the glandular level but were not among the most abundant proteins detected in whole-mouth saliva.
(D) Heatmap of transcript levels for genes involved according to GO categorization in protein N-linked or O-linked glycosylation. Heatmap colors indicate Z scores normalized for each row of data. Table S2 provides the list of glycosylation-related genes and their gene expression in salivary glands.
