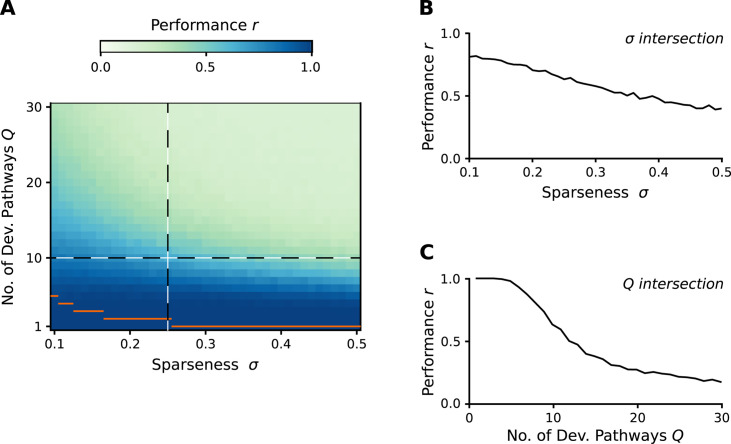
Fig 2. Performance of the analytic developmental networks.
We assumed different sparseness (proportion on non-zero entries in the state vectors) values and different number of embryo-adult pairs. Embryo and desired adult vectors were generated by independently setting each vector element to high or low randomly according to the sparseness value. The performance was measured by the averaged (over 400 realizations) Pearson correlation(s) between the desired and the experienced adult state(s) for all developmental pathways (panel A). Panels B and C show a more detailed view for the two cross-sections of the parameter space (indicated by dashed lines in panel A). Orange horizontal lines show the maximum number of orthogonal state vectors for the given sparseness values. Parameters: N = 100, δ = 0.2, τ = 1, ω = 25).

