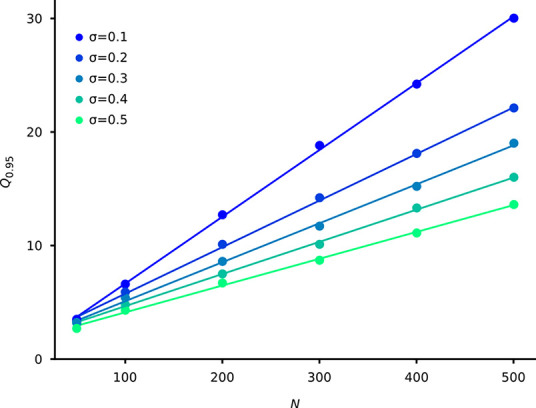
Fig 4. The memory capacity (Q0.95) as a function of the number of neurons (N) at different sparseness (σ).

Similar to Fig 2, each point is an average of 400 realizations. The lines are the linear regression fits (R2>0.99 in all cases).

Similar to Fig 2, each point is an average of 400 realizations. The lines are the linear regression fits (R2>0.99 in all cases).