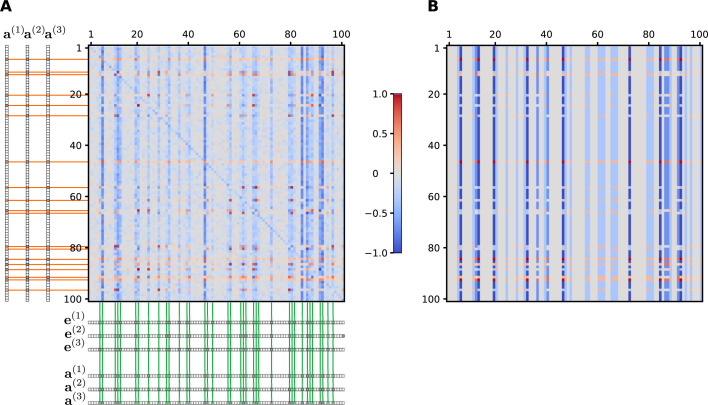
Fig 5. Structure of the interaction matrix obtained with the evolutionary algorithm as compared to the analytically derived one for three developmental pathways.
(A) The evolutionary interaction matrix was obtained by averaging the output of 300 independent runs of the evolutionary algorithm. The three applied environment-specific embryonic and adult state vectors are shown along the sides. Orange guidelines highlight those rows where the corresponding genes are expressed in at least one adult state, whereas green guidelines highlight those columns where at least one gene is expressed in any of the embryonic or adult states. (B) The theoretically predicted interaction matrix was constructed from the embryonic and adult state vectors using Eq (3). Parameters as in Fig 2 and Q = 3, K = 100, μW = 0.05, μe = 0.1, σ = 0.1.

