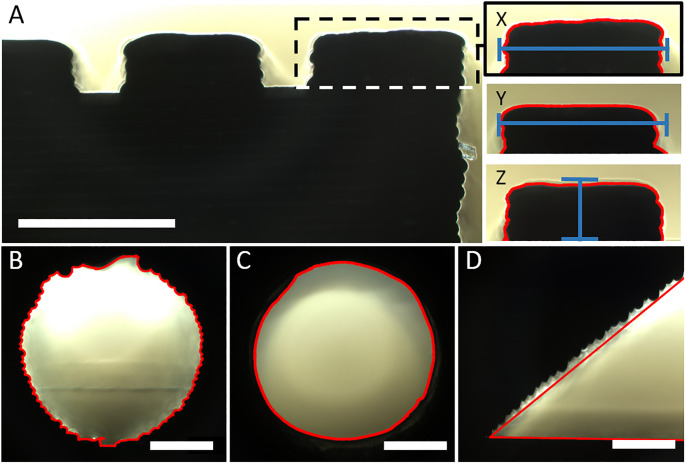
Fig 3. Evaluation of printed test bodies using Fiji macros.
Microscopic pictures of the test bodies were taken and the area of interest was cropped (dotted line). The shape was identified and analysed using self-written Fiji macros (red line). (A) For X and Y resolution test bodies (X and Y) the maximum width and for the Z resolution test body (Z) the maximum height was measured (blue line). For the horizontal printed channels (B) as well as the vertical printed channels (C), the feret diameter and the roundness was calculated. (D) The angle of the appropriate test body was measured manually using the angle measuring tool from Fiji (red line). Scale bar equals 1000 μm.

