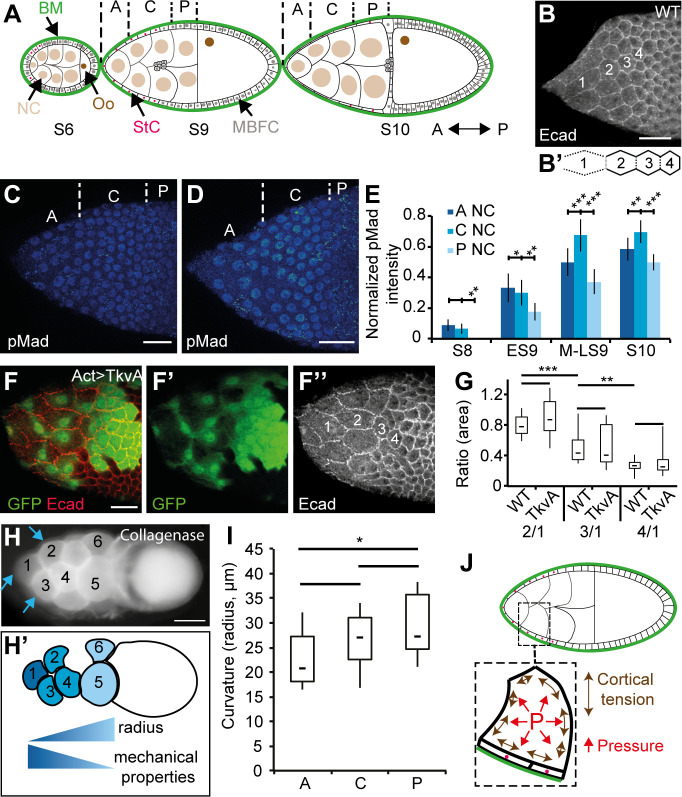
Fig 1. An A/P gradient of mechanical properties is present in the NCs.
In all figures, anterior is to the left. (A) Schematic representation of three follicles at different developmental stages (S6, S9, and S10) with NCs, Oo, MBFCs, StCs, and BM indicated. From S8 onward, NCs are grouped into three regions for analysis: anterior (“A”), central (“C”), and the four posterior (“P”) NCs. (B) AJs (Ecad) remodeling and increase of apical surface occur in the StC of an S9 follicle. Both variables are marker of flattening (see S1 Movie). Four cells are labeled from anterior (“1”) to posterior (“4”) to highlight changes in apical surface. (B') Schematic representation of AJ remodeling, with dotted lines representing remodeled AJ and solid lines representing intact AJ. The AJ disassembly consists of first remodeling the vertices on the same row and the AJ perpendicular to the A/P axis; second, elongating the AJ parallel to the AP axis; and third, disassembling those AJ (Fig 1B’). (C, D) pMad expression in early (C) and mid (D) WT S9 follicles. The anterior (“A”), central (“C”), and posterior (“P”) regions of the NC are indicated. (E) Quantification of pMad in follicular cells during StC flattening (n > 15 nuclei per condition). (F) TkvA-expressing StC in an S9 follicle marked by GFP (F and F’), and with StC labeled in increasing order from anterior to posterior (F”). (G) Box and whisker plot of the ratio of surface area of StC in WT or TkvA-expressing StC at the different positions shown in (B) or (F”), respectively (n > 23 cells per plot). (H) A WT S10 follicle after collagenase treatment, showing the NC bulging outward, with the corresponding schematic representation of the mechanical property gradient based on NC membrane curvature (the measured curvature corresponds to the membrane bulging outwards). Blue arrows point to the region of the membrane used to calculate the curvature (H’). (I) Box and whisker plot of the radius of curvature of anterior (“A”), central (“C”), or posterior (“P”) NC (n > 13 per region) in LS9 and S10 follicles. (J) Schematic representation of an S9 follicle, with a blow up on an NC, its overlying StC, and the BM. In the NC, cortical tension (double-sided arrows, in brown) and cytoplasmic pressure (“P,” in red) are represented. Scale bars: 20 μm (B-F) and 50 μm (H). Data for graphs (E), (G), and (I) can be found in the S1 Data file. In box and whisker plots in all figures, boxes extend from 25 to 75 percentile, with a line showing the median value. Whiskers extend to the most extreme values. In all figures with panels displaying levels in fluorescence intensity, a color-coded gradient from blue (low) to red (high) is used. In all figures, error bars indicate s.e.m. In all figures, *, **, and *** correspond to p < 0.5, p < 0.05, and p < 0.01 (t test), respectively. AJ, adherens junction; A/P, antero-posterior; BM, basement membrane; Ecad, Ecadherin; ES9, early S9; GFP, green fluorescent protein; LS9, late S9; MBFC, main body follicular cell; MS9, mid S9; NC, nurse cell; Oo, oocyte; pMad, phosphorylated form of Mad; S, stage; StC, stretched cell; TkvA, constitutively active form of Tkv; WT, wild type.

