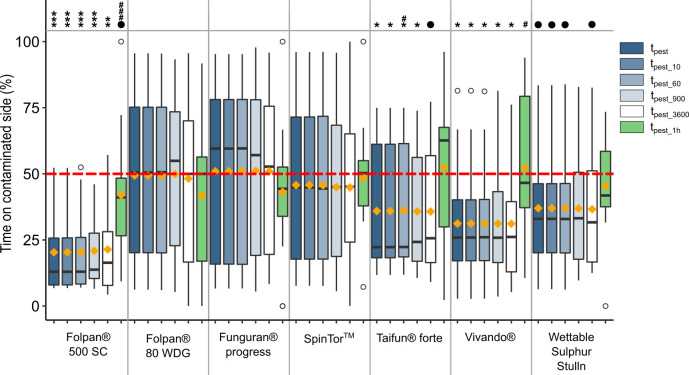
Fig 2. Boxplots showing the proportion of time a toad spent on the contaminated side of an arena for each tested formulation at the maximum recommended field rate (FRmax) and for different sampling intervals.
For the calculation of tpest all data over 24 hours were used. For tpest_10, tpest_60, tpest_900 and tpest_3600 only one side choice every 10, 60, 900 and 3,600 seconds, respectively, were considered. tpest_1h contains only data from the first hour of an experimental run. In each boxplot, the boundaries of the box are the 25th and 75th percentiles and the whiskers correspondent to the lowest and largest value no further than 1.5 times from the 25th and 75th percentiles away. Data points beyond the whiskers are shown as unfilled circles. Median values are presented as horizontal lines and orange diamonds show the mean values. Significant difference from a random choice (50%; red dotted line): ●: p adj. < 0.1; *: p adj. < 0.05; **: p adj. < 0.01; ***: p adj. < 0.001. P-values from tests with the same sampling interval were adjusted using the FDR. Significant differences compared to tpest: # = p < 0.05; ### = p < 0.001. N = 16 per choice-test.

