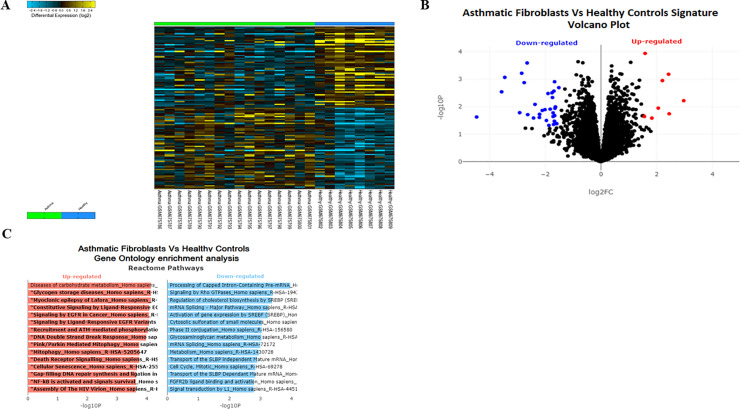
Fig 1. PINK/Parkin mediated mitophagy is among the top enriched pathways in asthmatic fibroblasts.
(A) Heatmap of differentially expressed genes (DEG) between asthmatic and healthy fibroblasts. (B) The log2-fold change and statistical significance of each gene was calculated by performing differential gene expression analysis. Each point in the plot represents a gene. Red points indicate significantly up-regulated genes and blue points indicate significantly down-regulated genes (logFC threshold = 1.5 and p-value threshold = 0.05). (C) Gene Ontology enrichment analysis was generated using Enrichr tool. The x-axis indicates the -log10(p-value) for each term. Significant terms are highlighted in bold. Only pathways with False Discovery Rate (FDR) less than 0.05 were selected.

