
Fig. 3. Mural Cells are required for increased amyloid accumulation in the iBBB.
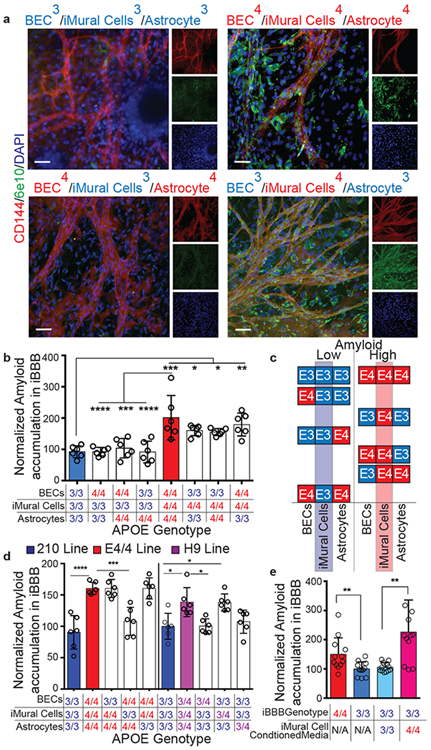
a, Representative images depicting combinatorial screen of APOE3/3 and APOE4/4 isogenic cell-types reveals that APOE4 expression in iMural cells is required for increased iBBB amyloid accumulation. These experiments were repeated 3 times. b, Quantification of amyloid accumulation in isogenic iBBBs for each permutation of combinatorial matrix. Each dot represents mean amyloid of four images. 6 iBBBs were analyzed for each condition. Center values represent mean and error bars are SD. Analysis was performed by one-way ANOVA with Bonferroni’s multiple comparison test where BECs/iMCs/Astrocytes: 3/3/3 v 4/4/4, p < 0.0001; 4/4/4 v 4/3/3, p < 0.0001; 4/4/4 v 4/3/4 p = 0.0004, 4/4/4 v 3/3/4 p < 0.0001; 3/3/3 v 3/4/3, p = 0.0391; 3/3/3 v 3/4/4, p = 0.050; 3/3/3 v 4/4/3 p = 0.0023. c, Segregating each isogenic permutation based on relative amyloid levels (low or high), reveals that APOE3/3 and APOE4/4 BECs and astrocytes are equally represented between the two conditions, however, iMural cells are not. For the low amyloid condition only APOE3/3 iMural cells are present. In contrast, for the high amyloid condition, only APOE4/4 iMural cells are present. d, Quantification of Aβ accumulation in iBBBs derived from APO3/3 (3), H9 is APOE3/4 heterozygous and 210 is APOE3/3 homozygous. Each dot represents mean amyloid of four images. 6 iBBBs were analyzed for each condition. Center values represent mean and error bars are SD. Analysis was performed by one-way ANOVA with Bonferroni’s multiple comparison test where BECs/iMCs/Astrocytes: 3/3/3 v 4/4/4 p < 0.0001; 4/4/4 v 4/3/4 p = 0.0004; 3/3/3 v H9/H9/H9 p = 0.0018; 3/3/3 v 3/H9/3, p = 0.002. e, Quantification of Aβ accumulation in isogenic iBBBs and APOE3/3 iBBBs treated with iMural cell conditioned media from either APOE3/3 (parental) or APOE4/4 (isogenic) iMural cell. Media was conditioned for 48 hours and added iBBBs with 1:1 ratio of fresh media and 20 nM Aβ-FITC for 96 hours. Each dot represents mean amyloid of 3 images. 12 iBBBs were analyzed for each condition. Center values represent mean and error bars are SD. Analysis was performed by two-sided student t-test where iBBB genotype/iMC conditioned media: 4/NA v 3/NA, p = 0.0095; 3/3 v 3/4, p = 0.001.