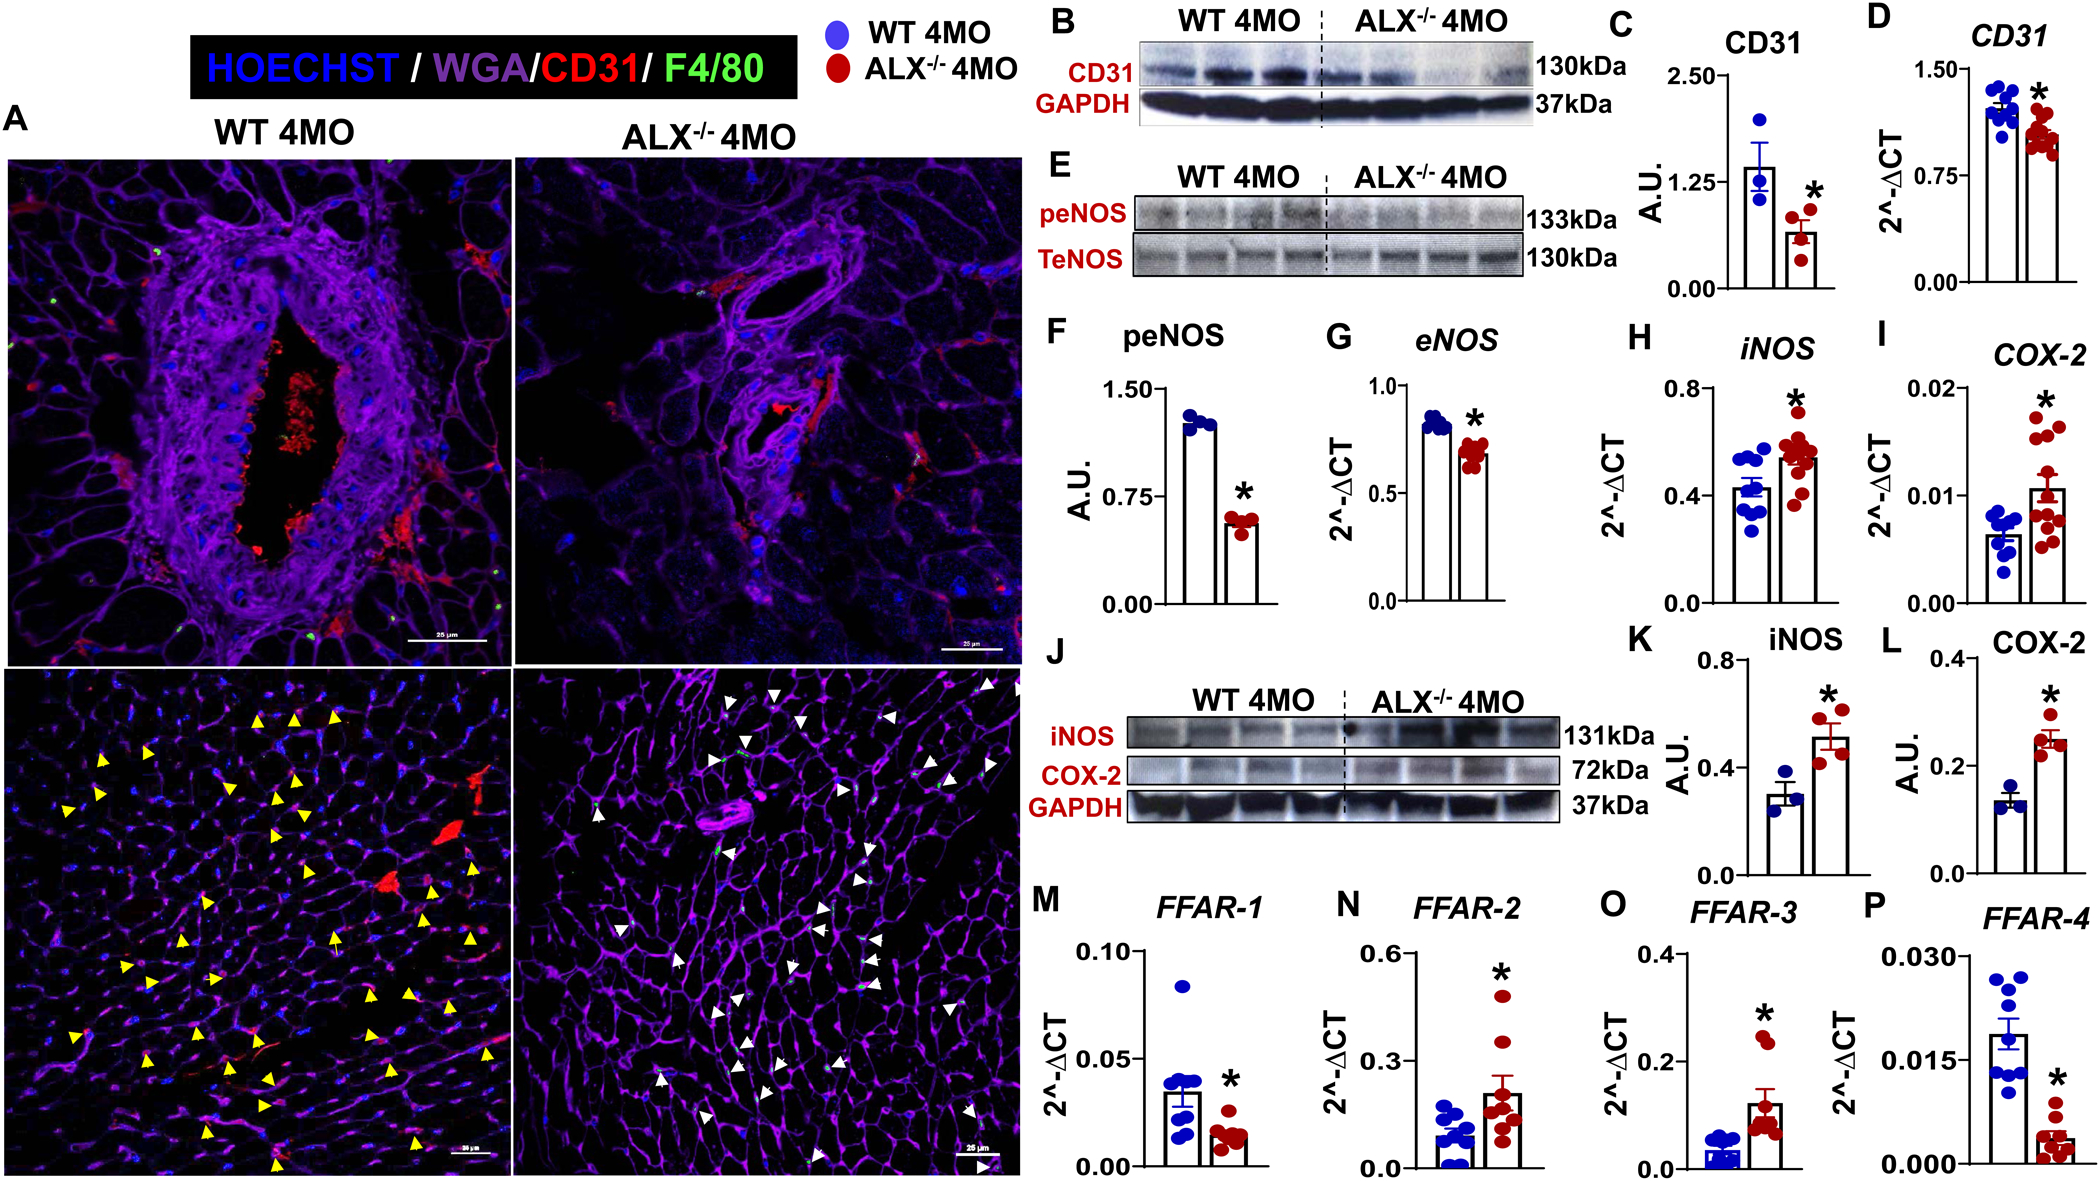
Figure 5. The absence of ALX set off the myocardium endothelial dysfunction.

(A) LV immunofluorescence images showing a decrease in CD31 (red) expression in ALX−/− mice. The upper panel images are of CD31(red) and F4/80 (green) cells around vessels which showing ALX−/− vessels have the low number of macrophages and reduced CD31 staining. The lower panel shows LV without a vessel. Yellow arrow denotes CD31 staining and white arrow denotes F4/80 staining. WGA (purple) is used for marking cell boundaries. Nuclei are stained with Hoechst (blue). Images are representative of 4–5 sections, n =4 mice/group. Magnification, 60x. Scale bars, 25μm, (B) Immunoblot of CD31 LV protein expressions, (C) Densitometry analysis of CD31, (D) mRNA expression of CD31, (E) Immunoblot of phospho (S1177) eNOS and total eNOS protein expression, (F) Densitometry analysis of phospho (S1177) eNOS/TeNOS, mRNA expression of (G) eNOS (H) iNOS (I) COX-2 (J) Immunoblot of iNOS, COX-2 and GAPDH protein expression. Densitometry analysis of (K) iNOS, (L) COX-2, and (M-P) mRNA expression of FFAR-1, −2,−3, and −4. The gene and protein expression are measured in LV of WT and ALX−/− mice at the age of 4 months. Protein expression is normalized to GAPDH and mRNA expression is normalized to HPRT-1. *, p<0.05 vs WT. n= 3–4 mice/group. values are means ± SEM.
