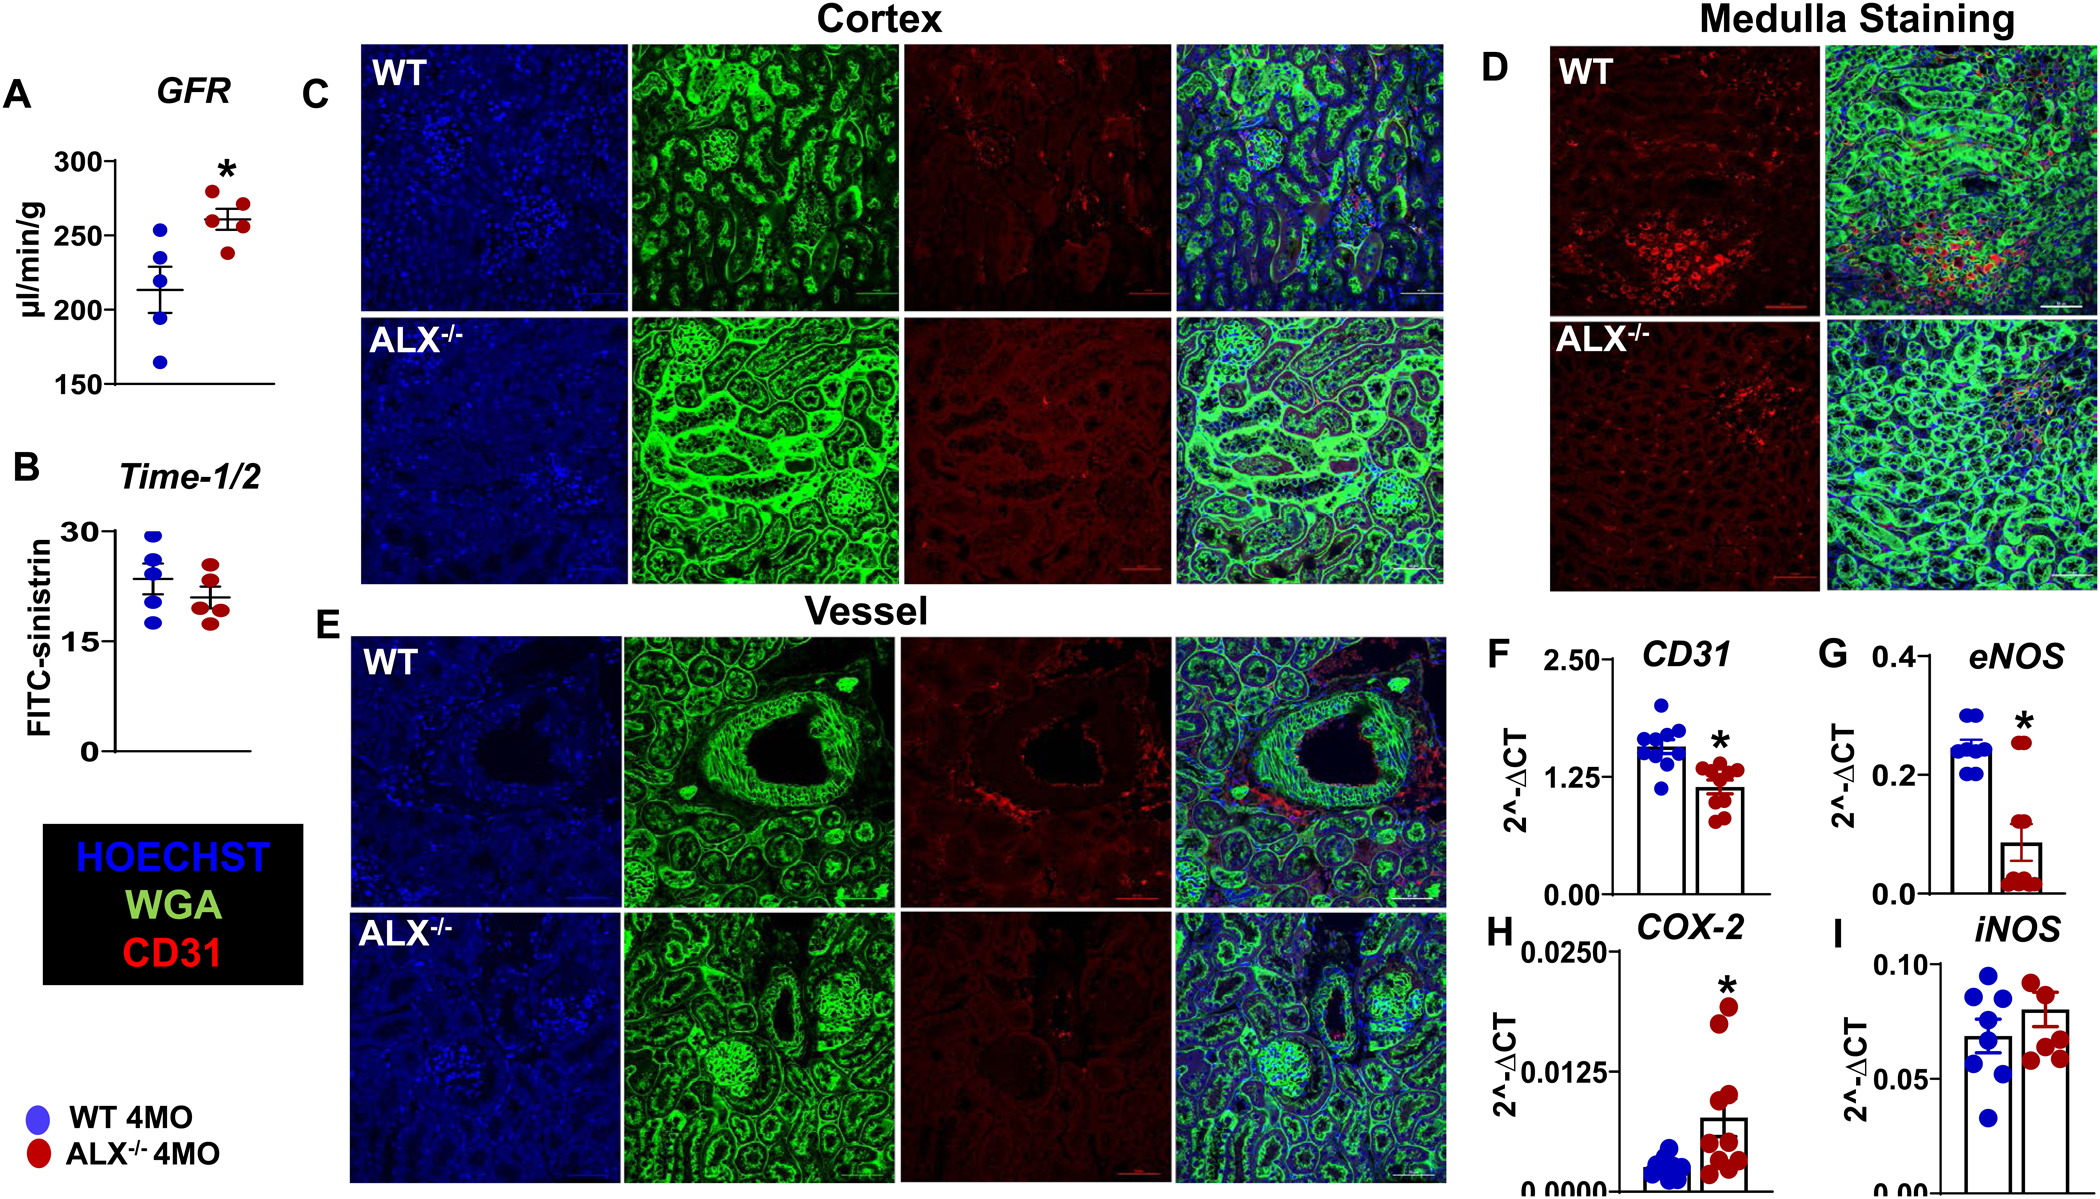
Figure 6. Obesity in ALX−/− mice advances kidney and endothelium dysfunction at the age of 4 months.

Bar graphs presenting (A) glomerular filtration rate (GFR) and (B) half time of injected FITC-sinistrin in the kidney of WT and ALX−/− mice. Representative immunofluorescence images of (C) cortex, (D) vessel, and (E) medulla stained with WGA (green)-CD31(red) in kidney of ALX−/− and WT mice. Images are representative of 4–5 sections, n =4 mice/group. Magnification, 60x. Scale bars, 50μm. Representative graph of mRNA gene expression in the kidney of (F) CD31, (G) eNOS, (H) COX-2, (I) iNOS in the WT and ALX−/− mice. mRNA expression is normalized to HPRT-1. *p<0.05 vs WT; n= 6 mice/group; values are means ± SEM.
