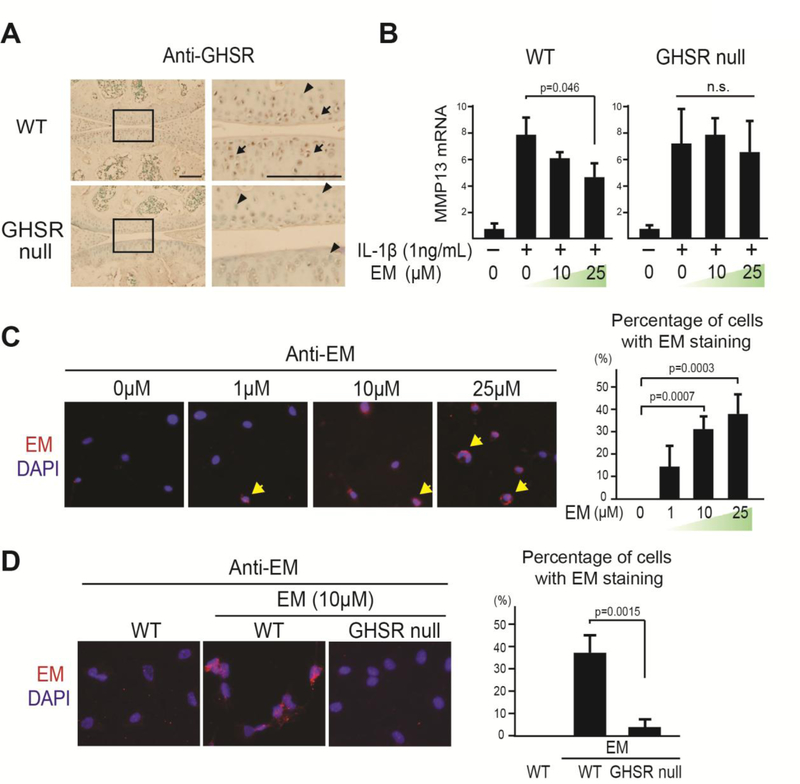
Fig. 2. The anti-inflammatory activity of EM in chondrocytes is mediated by the ghrelin receptor GHSR.
(A) Immunohistochemical (IHC) analysis using an anti-GHSR antibody (anti-GHS-R1a) on WT and GHSR null mouse knee joints. Rectangles denote areas magnified. Arrows and arrowhead indicate GHSR positive and negative cells, respectively. Scale bar = 200μm. (B) Relative MMP13 mRNA analysis on WT and GHSR null chondrocytes treated with EM (0, 10, and 25μM) and IL-1β (1ng/ml). TBP served as a loading control. (C) Immunocytochemistry (ICC) analysis with anti-EM antibody (red) on WT chondrocytes treated with different doses of EM (0, 1, 10, and 25μM) for 1hr. Arrows indicate cells with EM staining. Percentage of EM-positive cells was calculated. (D) ICC analysis with EM presence on WT and GHSR null chondrocytes treated with EM (10μM) for 1hr. Percentage of EM-positive cells was calculated. Data were reported as mean ± SD and analyzed by Dunnett’s test (B and C) and an unpaired t-test (D). At least three independent experiments were performed. * p<0.05. n.s: not significant.

