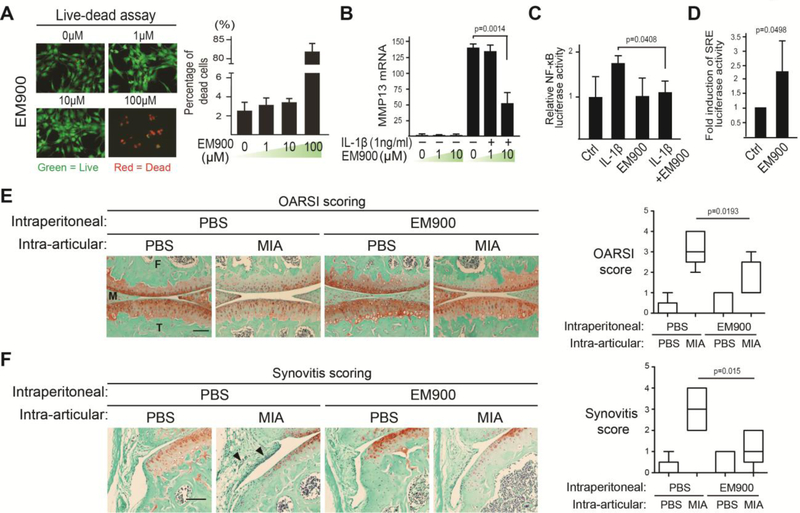
Fig. 5. EM900, a non-antibiotic EM derivative, inhibits IL-1β-induced MMP13 expression and NF-κB activation, and maintains joint health in MIA-injected knees.
(A) Live-dead assay on chondrocytes treated with EM900 (0, 1, 10 and 100μM) for 4 days. Percentage of dead cells/total cells was quantified. (B) RT-qPCR analysis of MMP13 mRNA on nHACs treated with EM900 (1, 10 and 25μM) overnight followed by IL-1β (1ng/mL) treatment for 3 days. TBP served as a reference gene. (C) NF-κB transactivation assay. nHACs were transiently transfected with the NF-κB reporter construct for 24 hours and then treated with EM900 (1μM) and IL-1β (1ng/mL). A Renilla luciferase construct was co-transfected as an internal control for normalization. (D) Serum Response Element (SRE) luciferase reporter assay as a readout of ghrelin receptor signaling. nHACs were transiently transfected with the SRE reporter construct for 24 hours and then treated with EM900 (10μM) and IL-1β (1ng/mL). A Renilla luciferase construct was co-transfected as an internal control for normalization. Data were presented as “fold activation” compared to untreated samples. (E) Safranin O staining images for cartilage matrix analysis of WT mouse knee joints. MIA was intra-articularly injected to knee joints at day 0. EM900 was IP-delivered daily from the day of MIA injection. Samples were collected for analysis 7 days later. The degree of cartilage matrix loss was scored according to the OARSI scoring system. Scale bar = 200μm. M = Meniscus. T = Tibia. F = Femur. (F) Synovitis analysis on sections from the medial tibial plateau of the WT mice knees injected with EM900. MIA was intra-articularly injected into knee joints at day 0. EM900 (PBS as control) was IP-injected into the mice daily until sample harvest at day 7. Arrowheads indicate thickening of the synovial layers and increased cellularity of resident cells. Synovitis was scored according to established synovitis scoring protocols. For A to D, data were reported as mean ± SD and analyzed by Dunnett’s test (B) and an unpaired t-test (C, D). For E and F, data were reported in a box plot, where the median, as well as the maximum and the minimum data points were indicated. Data from E and F were analyzed by Kruskal-Wallis statistical test followed by Mann-Whitney U test. * p<0.05.

