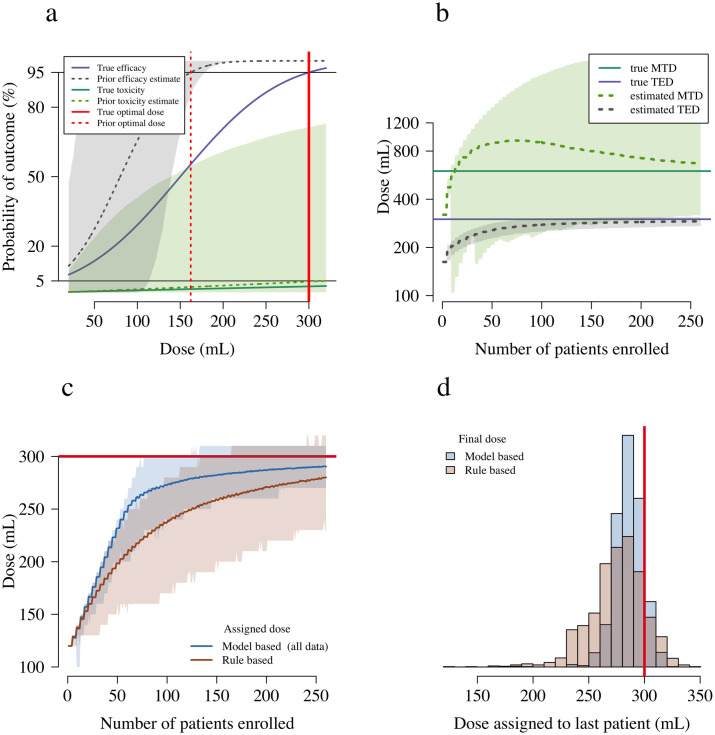
Fig 2. Operating characteristics of the rule based and model based designs under the simulation scenario 4.
In this scenario the simulation optimal dose is the TED (300 mL), shown as a thick red line in panels a, c and d. Panel a shows the simulation truth (thick lines) and the prior distributions used in the model based design (dashed lines: mean prior estimate; shaded areas: 90% credible interval). Panel b shows the evolution of the estimated MTD and TED as a function of the number of patients enrolled (dashed lines: estimate in the average trial; shaded areas: 90% interval of variation across trials). Panel c shows the assigned doses for each design: the thick lines show the assigned dose in the average trial; the shaded areas show 90% intervals of variation across trials. Panel d compares the distributions of the final assigned doses for the two designs.

