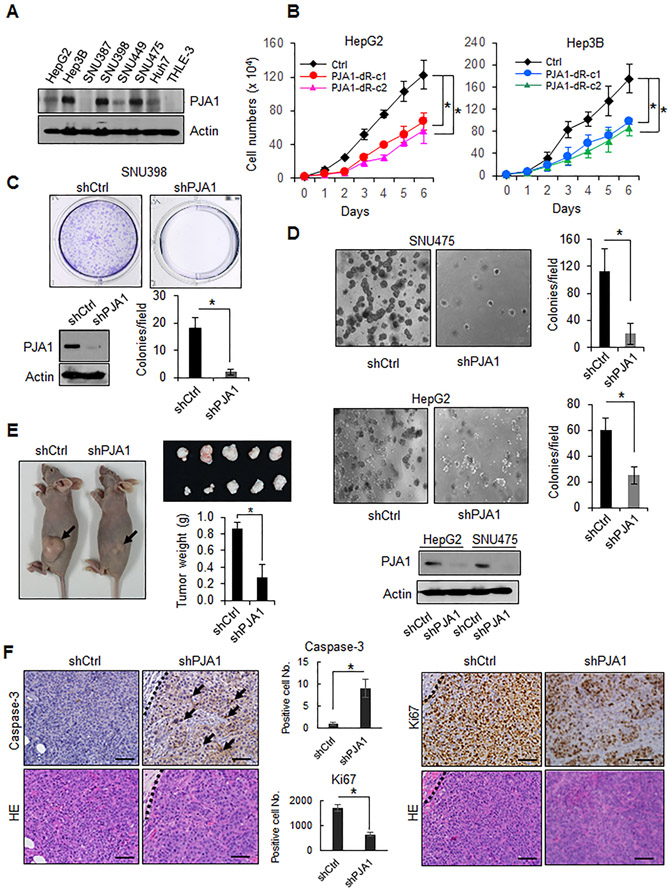
Figure 1.
PJA1 functions as a tumor promoter. (A) Abundance of PJA1 in liver cancer cell lines and normal hepatocytes. Cell lysates from a panel of liver cancer cell lines and a normal hepatocyte cell line THLE-3 were used. (B) Proliferation of stable cell lines overexpressing RING domain-deleted PJA1. Two stable lines (dR-c1 and dR-c2) were generated.*: P-value < 0.05, one-way analysis of variance. (C) Effect of PJA1 knock down on colony formation of SNU398 cells. A representative image of a well for each shRNA (upper panel) and quantitative data (lower right graph) from three independent experiments are shown. The effect of shRNA on PJA1 protein levels is shown (lower left). (D) Effect of knockdown of PJA1 on anchorage-independent colony formation of SNU475 and HepG2 cells grown in soft agar. The effects of shRNA on PJA1 protein levels in HepG2 and SNU475 cells are shown (lower panel). (E) Effect of PJA1 knockdown in SNU475 cells on tumor growth when xenografted subcutaneously into nude mice. Mice were injected with SNU475-shCtrl (n = 5 mice) or SNU475-shPJA1 cells (n = 5 mice). Representative mice bearing xenografts from each group, photographs of the tumors, and quantitative analysis of tumor weight are shown. (F) Histology and immunohistochemistry of xenografts in nude mice. Quantification of immunohistochemistry staining is shown in the bar graphs. Scale bars indicates 100 μm. For B-E, data are presented as mean ± standard deviation, and each result shown is representative of three independent experiments. For C-F, statistical analysis was performed by two-tailed Student’s t- tests (*, P-value < 0.05).

