Figure 2.
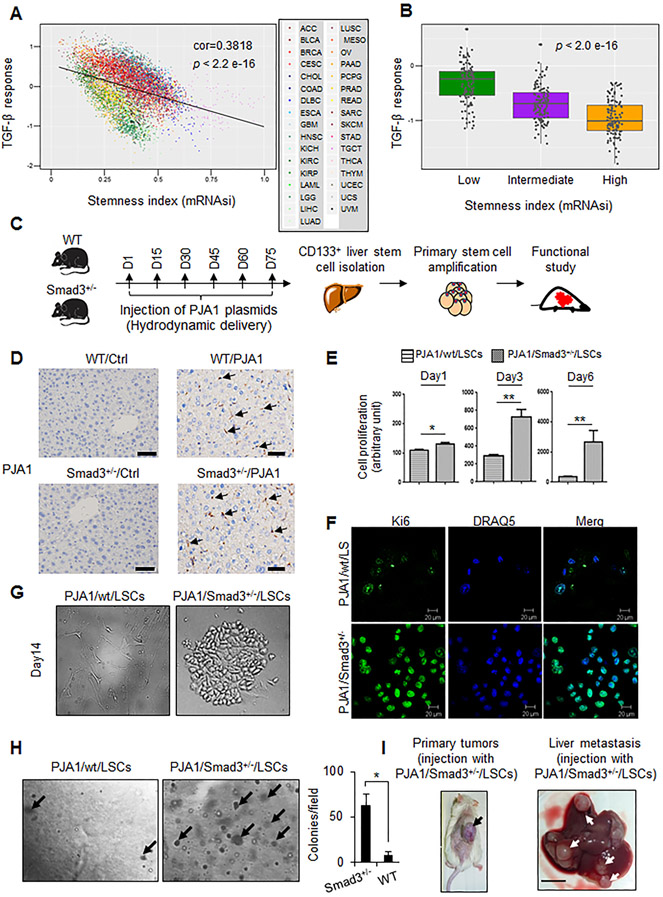
PJA1 promotes liver stem cell (LSC) proliferation and liver metastasis in Smad3+/− mice. (A) Negative correlation between cancer stem cell signature and TGF-β response in TCGA pan-cancer samples (n=9660). Scatter plot shows the position of each cancer sample, color indicates tumor type (abbreviations according to Supplementary Fig. S2). Significance was determined by Pearson correlation. (B) Relationship between TGF-β response score in TCGA HCC cohort and stemness status. TCGA HCC samples (n=368) were stratified based on the stemness status, defined by ranking the samples by their RNA-based stemness index (mRNAsi) and dividing the samples in top, intermediate, and bottom thirds. Statistical differences among the groups was assessed by 1-way ANOVA. (C) Diagram of the paradigm for generation and isolation of LSCs and analysis of their potential to function as cancer stem cells. Timeline shows days of tail vein injection of wild-type (WT) (n = 6) and Smad3+/− (n = 6) mice with PJA1-encoding plasmid over a 75-day period (D1, day 1; D15, day 15, and so on). (D) Presence of PJA1 in mouse livers in WT and Smad3+/− mice with hydrodynamic tail vein PJA1 injections. Representative immunohistochemical staining images of PJA1 from WT or Smad3+/− mouse injected with PJA1-encoding plasmids or control plasmid DNA (empty pB513B) for 3 months were shown. Scale bars indicates 50 μm. (E) Proliferative potential of CD133+ cells isolated from PJA1-injected wild-type mice (PJA1/wt/LSCs) and PJA1-injected Smad3+/− mice (PJA1/Smad3+/−/LSCs). CD133+ LSCs were cultured in Liver Cell Medium on lysine/laminin-coated plates. *:P < 0.05; ** :P < 0.001, one-way analysis of variance. (F) Identification of proliferative LSCs by immunostaining of Ki67. Nuclei were labeled with DRAQ5. (G) Differences in growth behavior of PJA1/Smad3+/−/LSCs and PJA1/wt/LSCs. CD133+ LSCs from wild-type or Smad3+/− mice were plated on lysine/laminin-coated plates and grown in Liver Cell Medium. Representative images are from day 14 in culture are shown. (H) Growth of LSC colonies in soft agar. Cells were grown for 4 weeks, and colonies were counted from three experiments. *, P-value < 0.05, two-tailed Student’s t- test. (I) Tumor formation by PJA1/Smad3+/−/LSCs or PJA1/wt/LSCs. LSCs were injected subcutaneously into NOD SCID gamma chain knockout (NSG) mice (n = 6, per cell line). After 30 days, mice were sacrificed and evaluated for the formation of tumors at the site of injection and in the liver. Representative images from the 2 mice injected with PJA1/Smad3+/−/LSCs that developed tumors are shown. Scale bar indicates 5 mm. For E and H, quantitative data are presented as mean ± standard deviation.

