Figure 6.
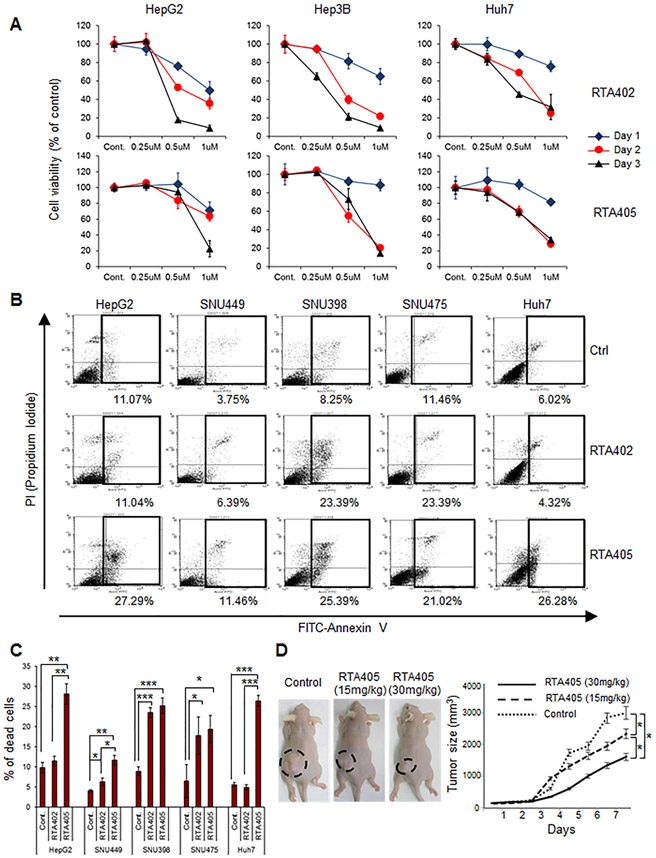
RTA402 and RTA405 induces apoptosis and inhibits growth of liver cancer cell lines in vitro and in vivo. (A) Effect of RTA402 or RTA405 on HCC cell viability in culture. The indicated cells were treated with the indicated concentrations of RTA402 or RTA405 for various times. (B) Induction of apoptosis in HCC cells exposed to RTA402 or RTA405. The indicated cells were treated with RTA402 (1 μM) or RTA405 (1 μM) for 2 hours. Representative results of FACS analysis for three independent experiments are shown. Percent apoptotic cells from the boxed areas are indicated beneath each FACS plot. (C) Quantitative data of FACS analysis in (B). Data are shown as mean ± standard deviation of three independent experiments. *: P < 0.05, **: P < 0.01, ***: P < 0.001, 1-way ANOVA with post-hoc Bonferroni’s test. (D) Effect of RTA405 on HCC tumor growth. Mice were subcutaneously injected with 5 × 10⁶ HepG2 cells and intraperitoneally injected with PBS (control), RTA405 (15 mg/kg), or RTA405 (30 mg/kg). Six mice were used for each treatment group. Error bars are shown as mean ± standard deviations. * P < 0.05, one-way analysis of variance.

