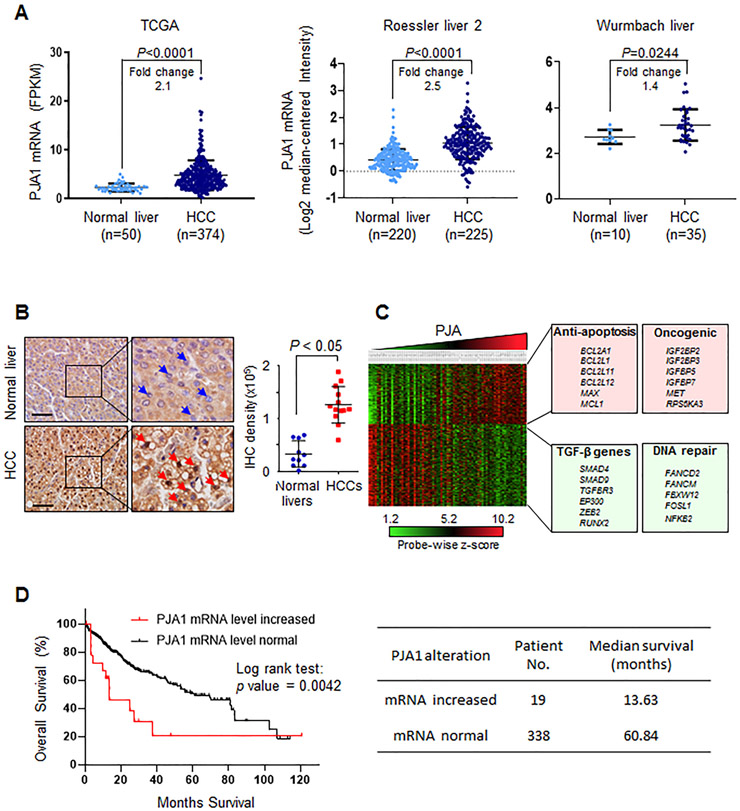
Figure 7.
PJA1 is a potential target for therapeutic intervention in HCC. (A) The abundance of PJA1 mRNA in HCC compared to that in normal liver tissue from three independent cancer datasets. Fold-change compares the difference in the mean. (B) Immunohistochemical staining for PJA1 abundance in normal liver (n = 10) and HCC (n = 13). Blue arrowheads point to negative PJA1 staining in cell nucleus; red arrowheads indicate positive PJA1 staining in cell nucleus. Magnification × 10; inset magnification × 40. Scale bar is 100 μm. For A and B, mean ± standard deviation is indicated. Statistical analysis was performed by two-tailed Student’s t- tests. (C) Transcriptomic analyses of HCC patient datasets from Gene Expression Omnibus (GSE9843, n = 91). Transcriptomic data was clustered into 4 quartiles according to PJA1 expression using Nexus Expression 3.0. Representative pathways and genes associated with high PJA1 expression are listed. Green-boxed genes are those with a negative correlation with PJA1 expression and red-boxed genes are those a positive correlation with PJA1 expression. (D) Overall survival analysis of TCGA HCC patient dataset. Overall survival according to increased or normal mRNA levels of PJA1 in HCC patients shows statistically significant differences (Log rank Test, P=0.0042) (left panel). Median survival of these two groups were listed on the right panel.

