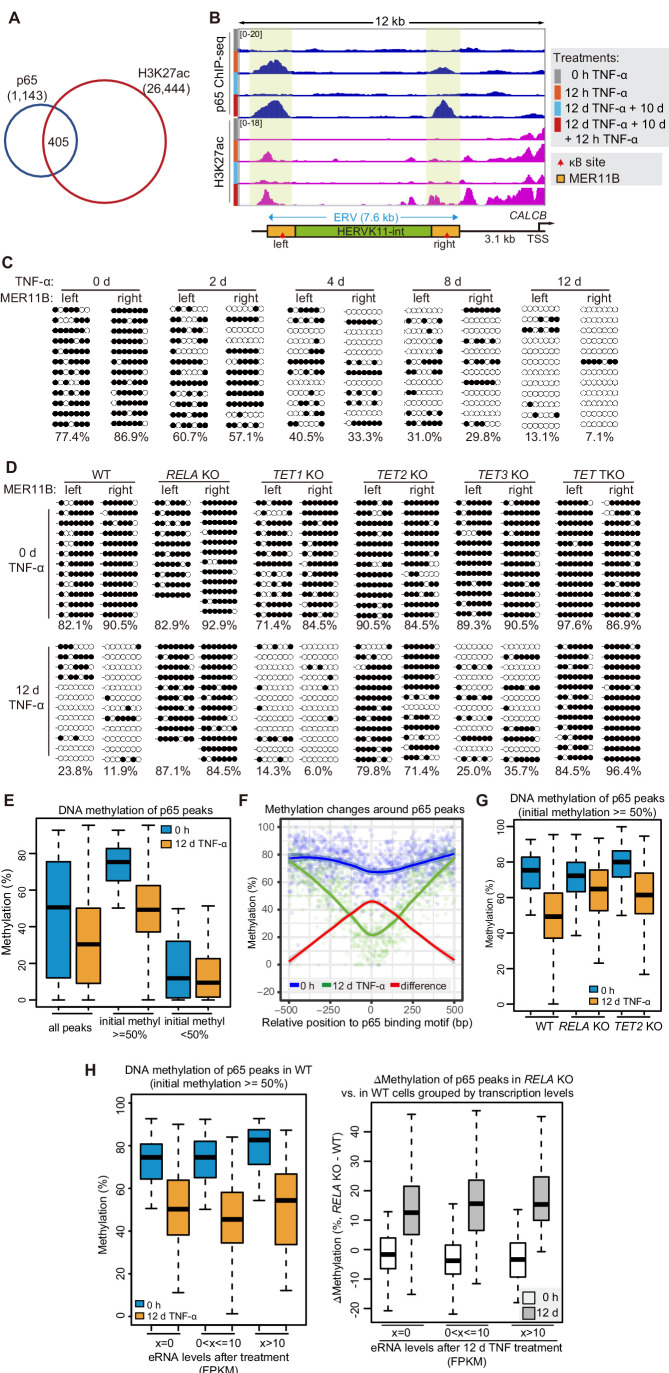
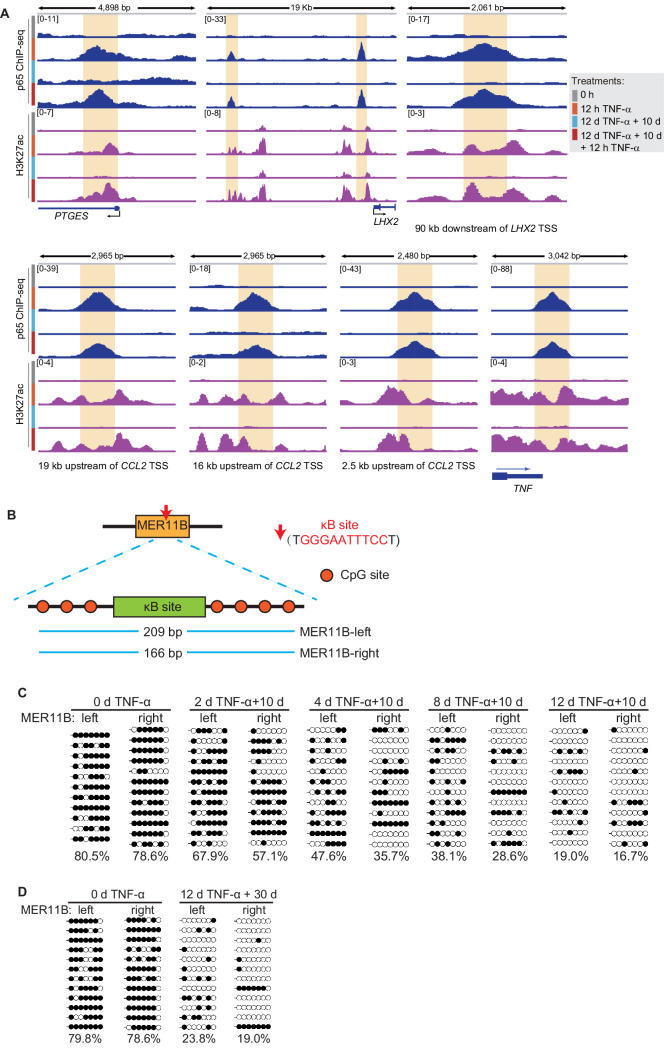
Figure 4. DNA demethylation of TNF-α-responsive elements during memory consolidation depends on TET enzymes and p65.
(A) Overlap between p65 ChIP-seq peaks and H3K27ac ChIP-seq peaks in cells treated with TNF-α for 12 hr. (B) Genome browser view shows p65 occupancy and H3K27ac ChIP-seq signal at the endogenous retrovirus (ERV) region upstream of CALCB gene. (C) Locus-specific bisulfite sequencing results of MER11B-left LTR and MER11B-right elements for the cells treated with TNF-α for 0 day, 2 days, 4 days, 8 days, and 12 days. (D) Locus-specific bisulfite sequencing results show the DNA methylation level of MER11B-left LTR and MER11B-right elements for 0-day and 12-day TNF-α-treated WT, TET1 KO, TET2 KO, TET3 KO, TET TKO, and RELA KO cells. (E) Changes of DNA methylation of p65 peaks in 12-day TNF-α-treated cells vs. 0 hr treated cell. Highly methylated and lowly methylated regions are also shown separately. (F) DNA methylation around p65 peaks. Colored dots indicate each CpG by relative positions to the binding motif with the highest score. Lowess-smoothed curves were drawn for 0 hr (blue), 12-day TNF-α treatment (green), and the differences between them (red). (G) Average methylation level of p65 peaks in WT, RELA KO, and TET2 KO cell with 0 hr or 12-day TNF-α treatment. Only p65 peaks that were initially methylated (methylation level ≥50%) are plotted. (H) Left panel shows average methylation level of p65 peaks in WT cells with 0 hr or 12 days TNF-α treatment, categorized by three indicated transcription levels (eRNA at peaks normalized in RPKM). Right panel shows the methylation difference of p65 peaks in RELA KO in comparison to that in WT cells, with or without 12-day TNF-α treatment. Similar to panel G, p65 peaks that were initially methylated (methylation level ≥50%) are used in panel H.


