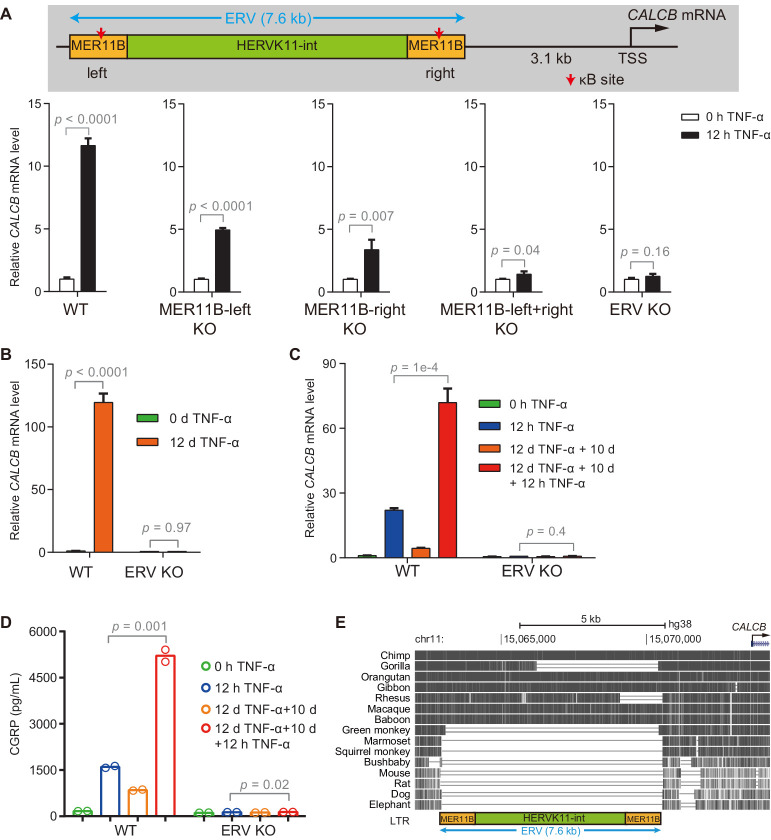
Figure 5. The ERV upstream of CALCB is required for its TNF-α-induced activation and transcriptional memory.
(A) RT-qPCR results show the CALCB mRNA level of WT, MER11B-left KO, MER11B-right KO, MER11B-left+right KO, and ERV KO cells treated with TNF-α for 0 hr and 12 hr. GAPDH is used as the internal control. Data are shown as mean ± SD from three independent experiments. Two-tailed t-test. (B) RT-qPCR results show CALCB transcriptional levels at 0 hr and 12 days in TNF-α-treated WT and ERV KO cells. GAPDH is used as the internal control. Data are shown as mean ± SD from three independent experiments. Two-tailed t-test. (C) RT-qPCR results show the transcriptional memory of CALCB in WT and ERV KO cells in response to TNF-α. GAPDH is used as the internal control. Data are shown as mean ± SD from three independent experiments. One-tailed t-test. (D) Sandwich ELISA results show the CGRP release level in the media for WT and ERV KO cells in response to TNF-α. Data are shown as the mean from two independent experiments. One-tailed t-test. (E) UCSC genome browser track shows multiple alignments of the ERV region upstream of the CALCB gene in selected vertebrate species.


