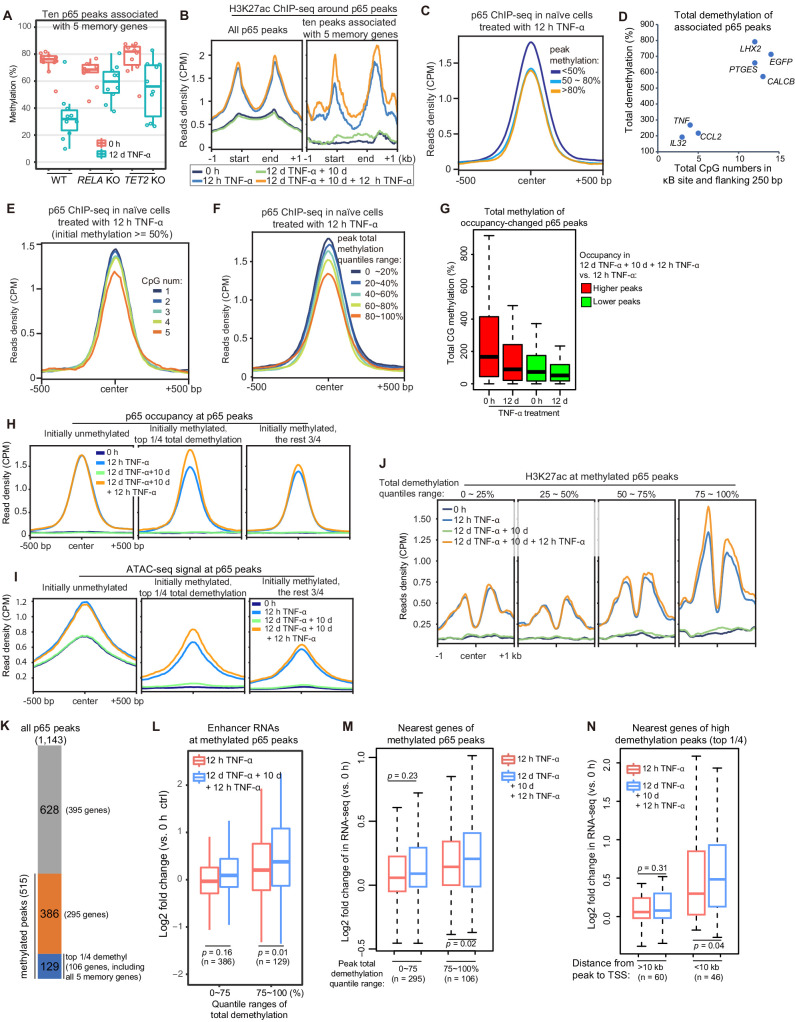
Figure 6. High initial methylation level and CpG density determine the functional potential of transcriptional memory modules in response to TNF-α stimulation.
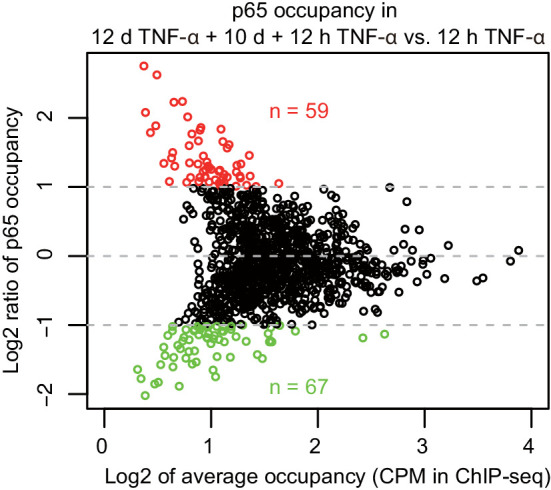
(A) Methylation levels of ten p65 peaks that are associated with the five memory genes. Average values of p65 peaks are shown as circles for 0 hr and 12 days TNF-α-treated WT, RELA KO and TET2 KO cells, respectively. (B) H3K27ac ChIP-seq profiles around all p65 peaks (left) and ten peaks that are associated with five memory genes (right). Different colors indicate cells with various treatments. (C) Averaged profile of p65 ChIP-seq at p65 peaks grouped by various peak methylation levels. In addition to sequencing depth, read counts located at initially unmethylated p65 peaks (methylation level less than 20%) were used to determine the scale factor for normalization of ChIP-seq signals. Peak-centered 1 kb region are shown. (D) Five memory genes, together with EGFP and IL32, are plotted for their CpG numbers and total demethylation of associated p65 peaks in the flanking 250 bp regions of κB sites. (E) Averaged profile of p65 ChIP-seq at methylated p65 peaks grouped by CpG numbers. (F) Averaged profile of p65 ChIP-seq at p65 peaks grouped by total methylations in five ranges of quantiles. (G) Total methylation level of occupancy-changed p65 peaks that were treated with 0 hr or 12 days TNF-α. Red columns stand for p65 peaks that are relatively higher in the second induction, and green ones stand for p65 peaks that are relatively lower in the second induction (as indicated in Figure 6—figure supplement 1). (H) Averaged p65 occupancy at p65 peaks that are categorized into three groups by initial methylation level and total demethylations in 12-day TNF-α treatment vs. 0 hr. The left plot shows initially unmethylated p65 peaks (mCG <20%), the middle one shows initially methylated p65 peaks with the top 25% total demethylation after 12-day TNF-α treatment (higher than the upper quartile, Q3), and the right one shows initially methylated p65 peaks with the lowest 75% total demethylation. The four treatments are shown in indicated colors. (I) Averaged ATAC-seq profile at p65 peaks that are categorized into three groups by the same criteria as that used in panel H. (J) Averaged profile of H3K27ac ChIP-seq at methylated p65 peaks that are grouped into four ranges of quantiles by total demethylations in 12-day TNF-α treatment vs. 0 hr. The four treatments are shown in indicated colors. (K) The number of p65 peaks and their associated genes in designated groups. (L) Expression changes of enhancer RNAs at p65 peaks with different degree of demethylation. Paired two-tailed t-test. (M) Expression changes of nearest genes of methylated p65 peaks. Paired two-tailed t-test. (N) Impact of distance between p65 peaks and TSSs of neighboring genes. Paired two-tailed t-test.
Figure 6—figure supplement 1. MA-plot of p65 occupancy in two times of induction.


