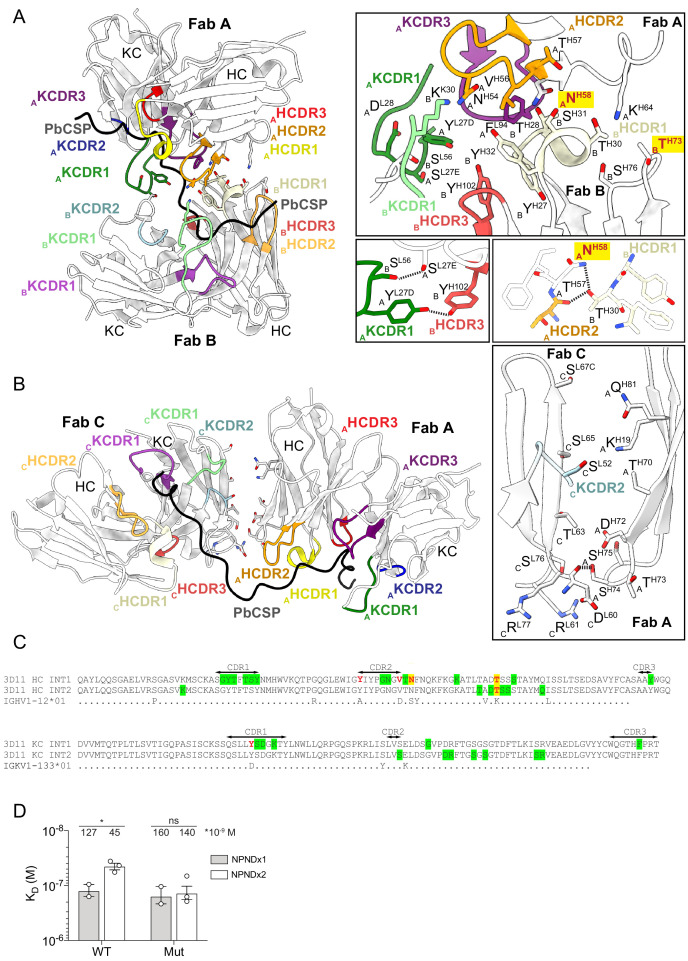
Figure 5. Homotypic interactions between 3D11 Fabs stabilize the 3D11 Fab-PbCSP complex.
(A and B) Close-up views of adjacent 3D11 Fabs from the cryoEM structure in complex with PbCSP (black). 3D11 Fabs bound to PbCSP form homotypic contacts with each adjacent Fab through two interfaces; one consisting of CDRs from the heavy and light chains of Fabs A and B (interface 1, A), and the second mediated by residues in FR3 of Fab A HC and FR3 of Fab C LC (interface 2, B). Variable domains of Fabs are shown in white. HCDR1, −2,–3, and KCDR1, −2 and −3 are colored yellow, orange, red, green, blue and purple, respectively. Residues forming Fab-Fab contacts are labeled with the position of the Fab in the cryoEM model (A, B or C) indicated in subscript. mAb 3D11 affinity-matured residues that engage in Fab-Fab contacts, but do not directly interact with PbCSP are highlighted in yellow with red font. Black dashed lines denote H-bonds. (C) Sequence alignment of mAb 3D11 with its inferred germline precursor. INT1 and INT2 refer to the two interfaces shown in (A) and (B). Green highlight: germline-encoded residues involved in homotypic interactions; Red: affinity-matured residues involved in homotypic interactions; Yellow highlight: affinity-matured residues involved in homotypic interactions that do not directly interact with PbCSP. (D) Binding affinity of WT 3D11 and H-58/73 germline-reverted mutant (Mut) Fabs to NPNDx1 (gray bars) and NPNDx2 (white bars) peptides as measured by ITC. Symbols represent independent measurements. Mean KD values resulting from at least two independent experiments are shown. Error bars represent standard error of the mean. An unpaired one-tailed t-test was performed using GraphPad Prism 8 to evaluate statistical significance: *p<0.05.


