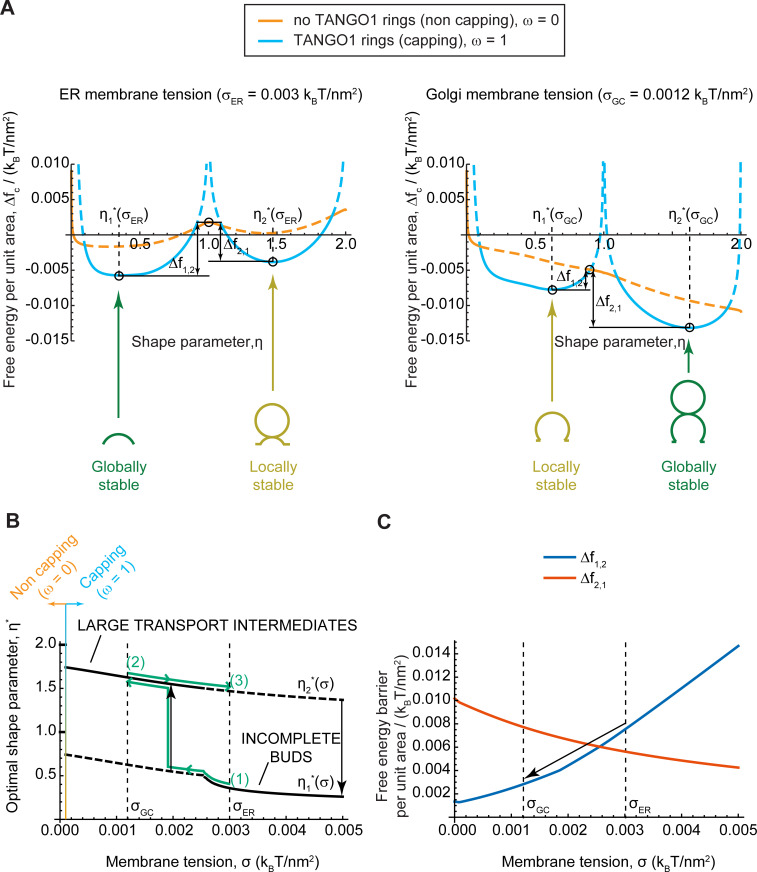
Figure 4. Equilibrium analytic model explains tension-mediated carrier growth in terms of energetically accessible configurations.
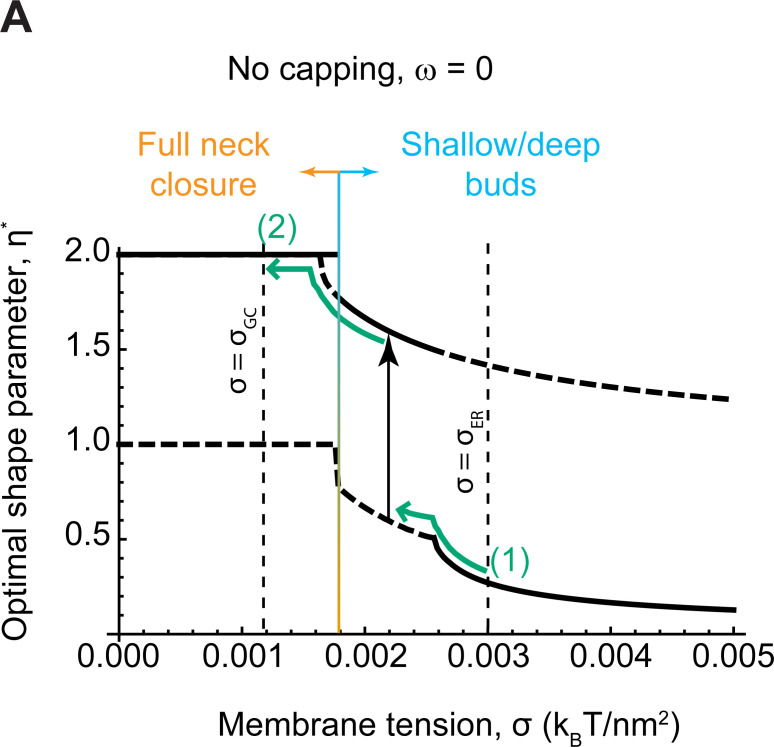
(A) Free energy per unit area of the transport intermediate-TANGO1 system, , as a function of the shape parameter, , at typical ER membrane tension (left), and Golgi membrane tension (right), for fully capped (, sly blue curves), and non-capped (, orange curves) cases. Solid lines indicate the locally stable states (lower free energy). Schematics of the transport intermediate shapes for the optimal shape parameters, , are represented at the global and local equilibrium states. (B) Optimal shape parameters,, as a function of the membrane tension, . Globally stable shapes are indicated with solid lines, while locally stables shapes are shown by dashed lines. A transient reduction in the membrane tension (green arrows from point (1) to point (2)) can lead to the growth of the transport intermediate (black vertical arrow), whereas recovery of the tension to the initial value (green arrows from point (2) to point (3)) can keep the system in a kinetically arrested metastable configuration. The capping-uncapping transition is depicted by the orange-to-sky blue gradient line. (C) The free energy barriers separating the incomplete bud from the large intermediate morphologies, (blue line), and (vermillion line) as defined in (A), plotted as a function of the membrane tension, . The arrow illustrates how a decrease in membrane tension reduces the energy barrier for growth of the transport intermediate. All parameter values are reported in Appendix 2—table 1, with no applied force, .


