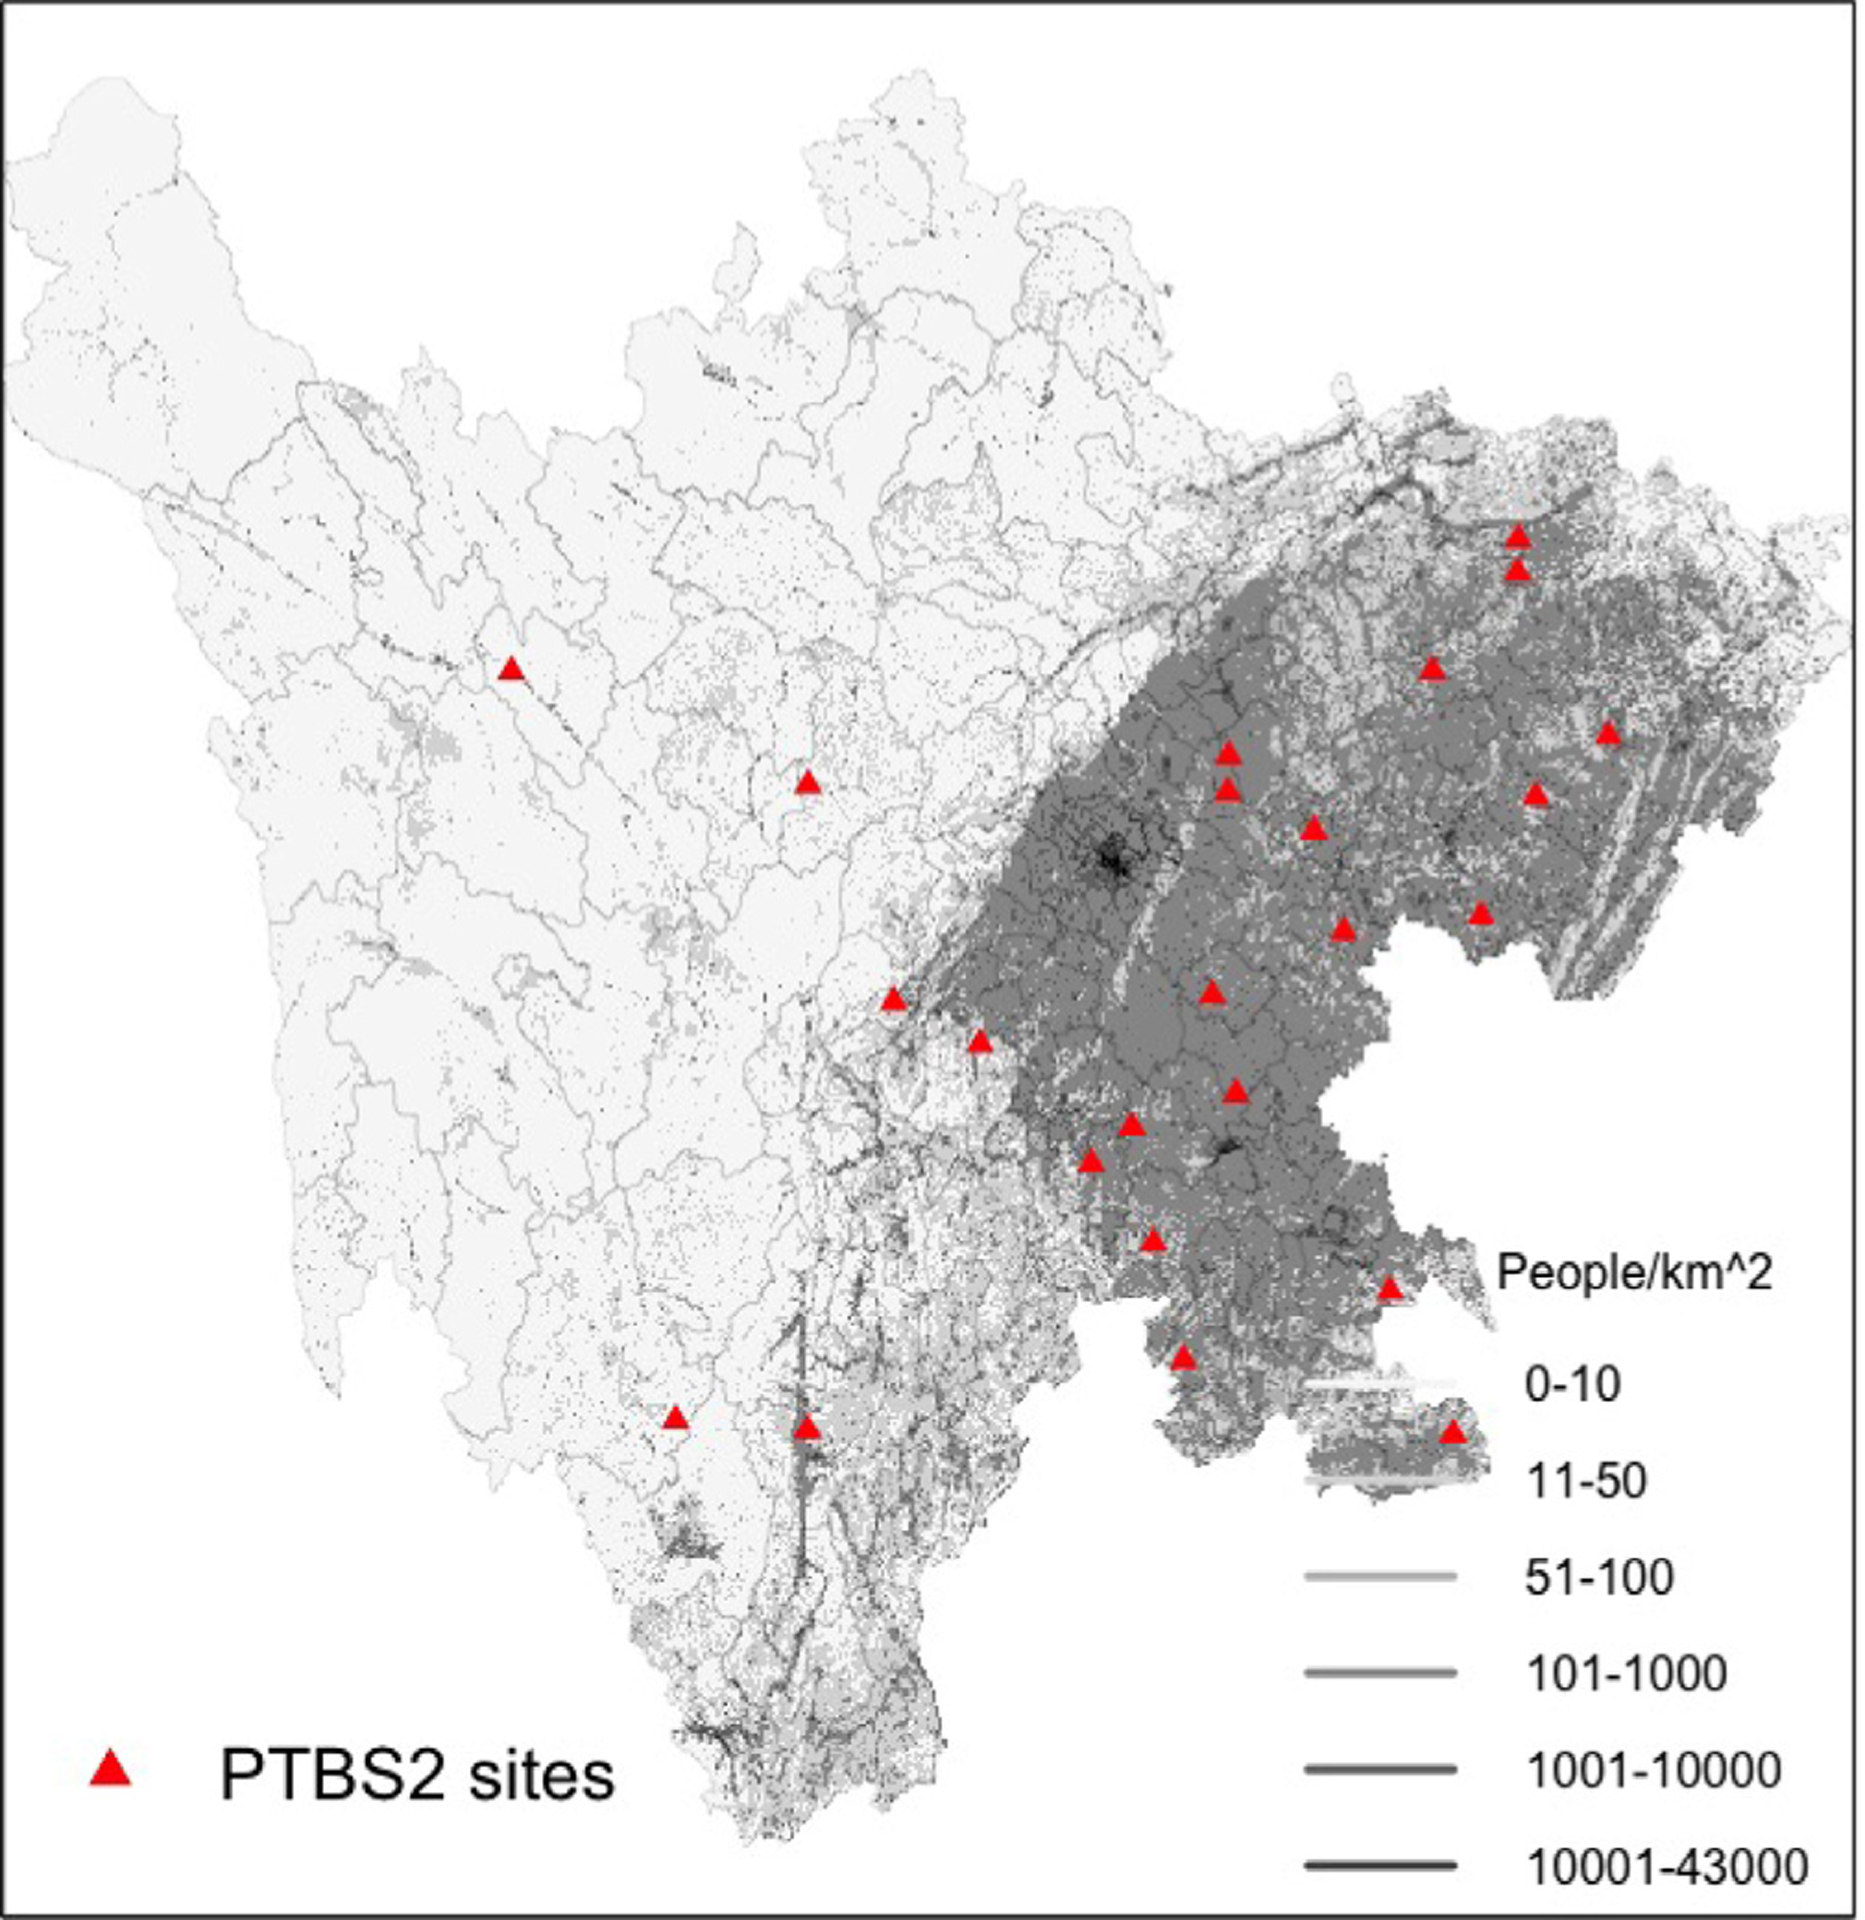
Fig. 1.

A map of the study region where the framework was tested, showing population density (Dobson et al., 2000)(grey shading), county borders (thin black boundaries), and location of 24 surveillance sites in Sichuan Province where linkage of PTBS1 and PTBS2 data was conducted.
