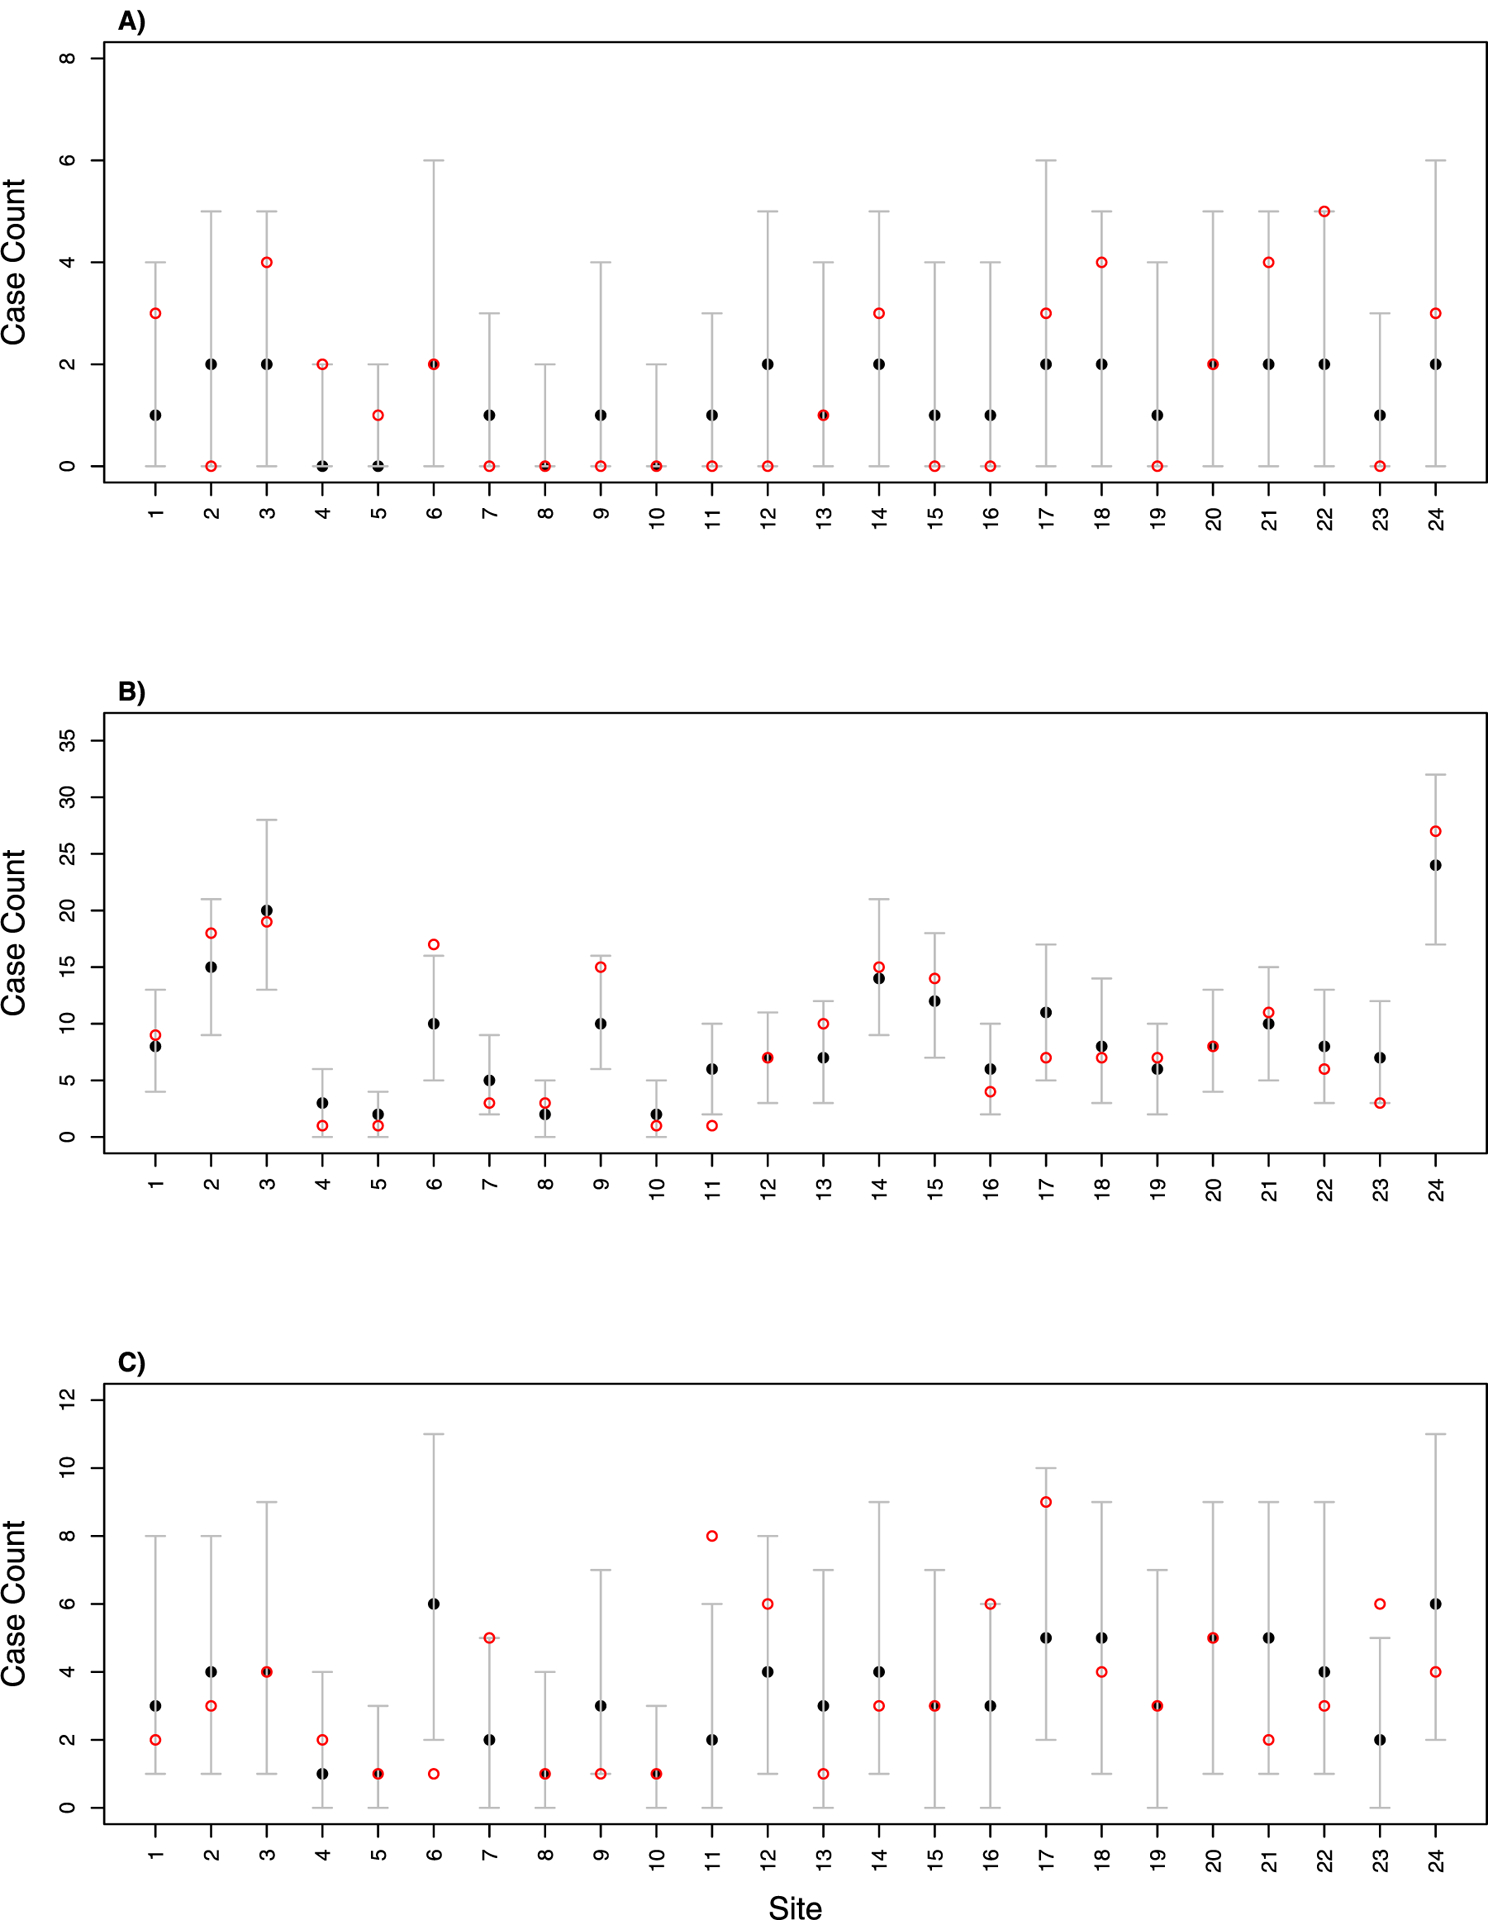
Fig. 2.

The in-sample prediction of: (A) PTBS1 only, (B) PTBS2 only, and (C) joint PTBS1/PTBS2 across the 24 sites. Figures show the true counts (red hollow points) and 2.5%, 50% and 97.5% percentile of posterior distributions (black dots and error bars).
