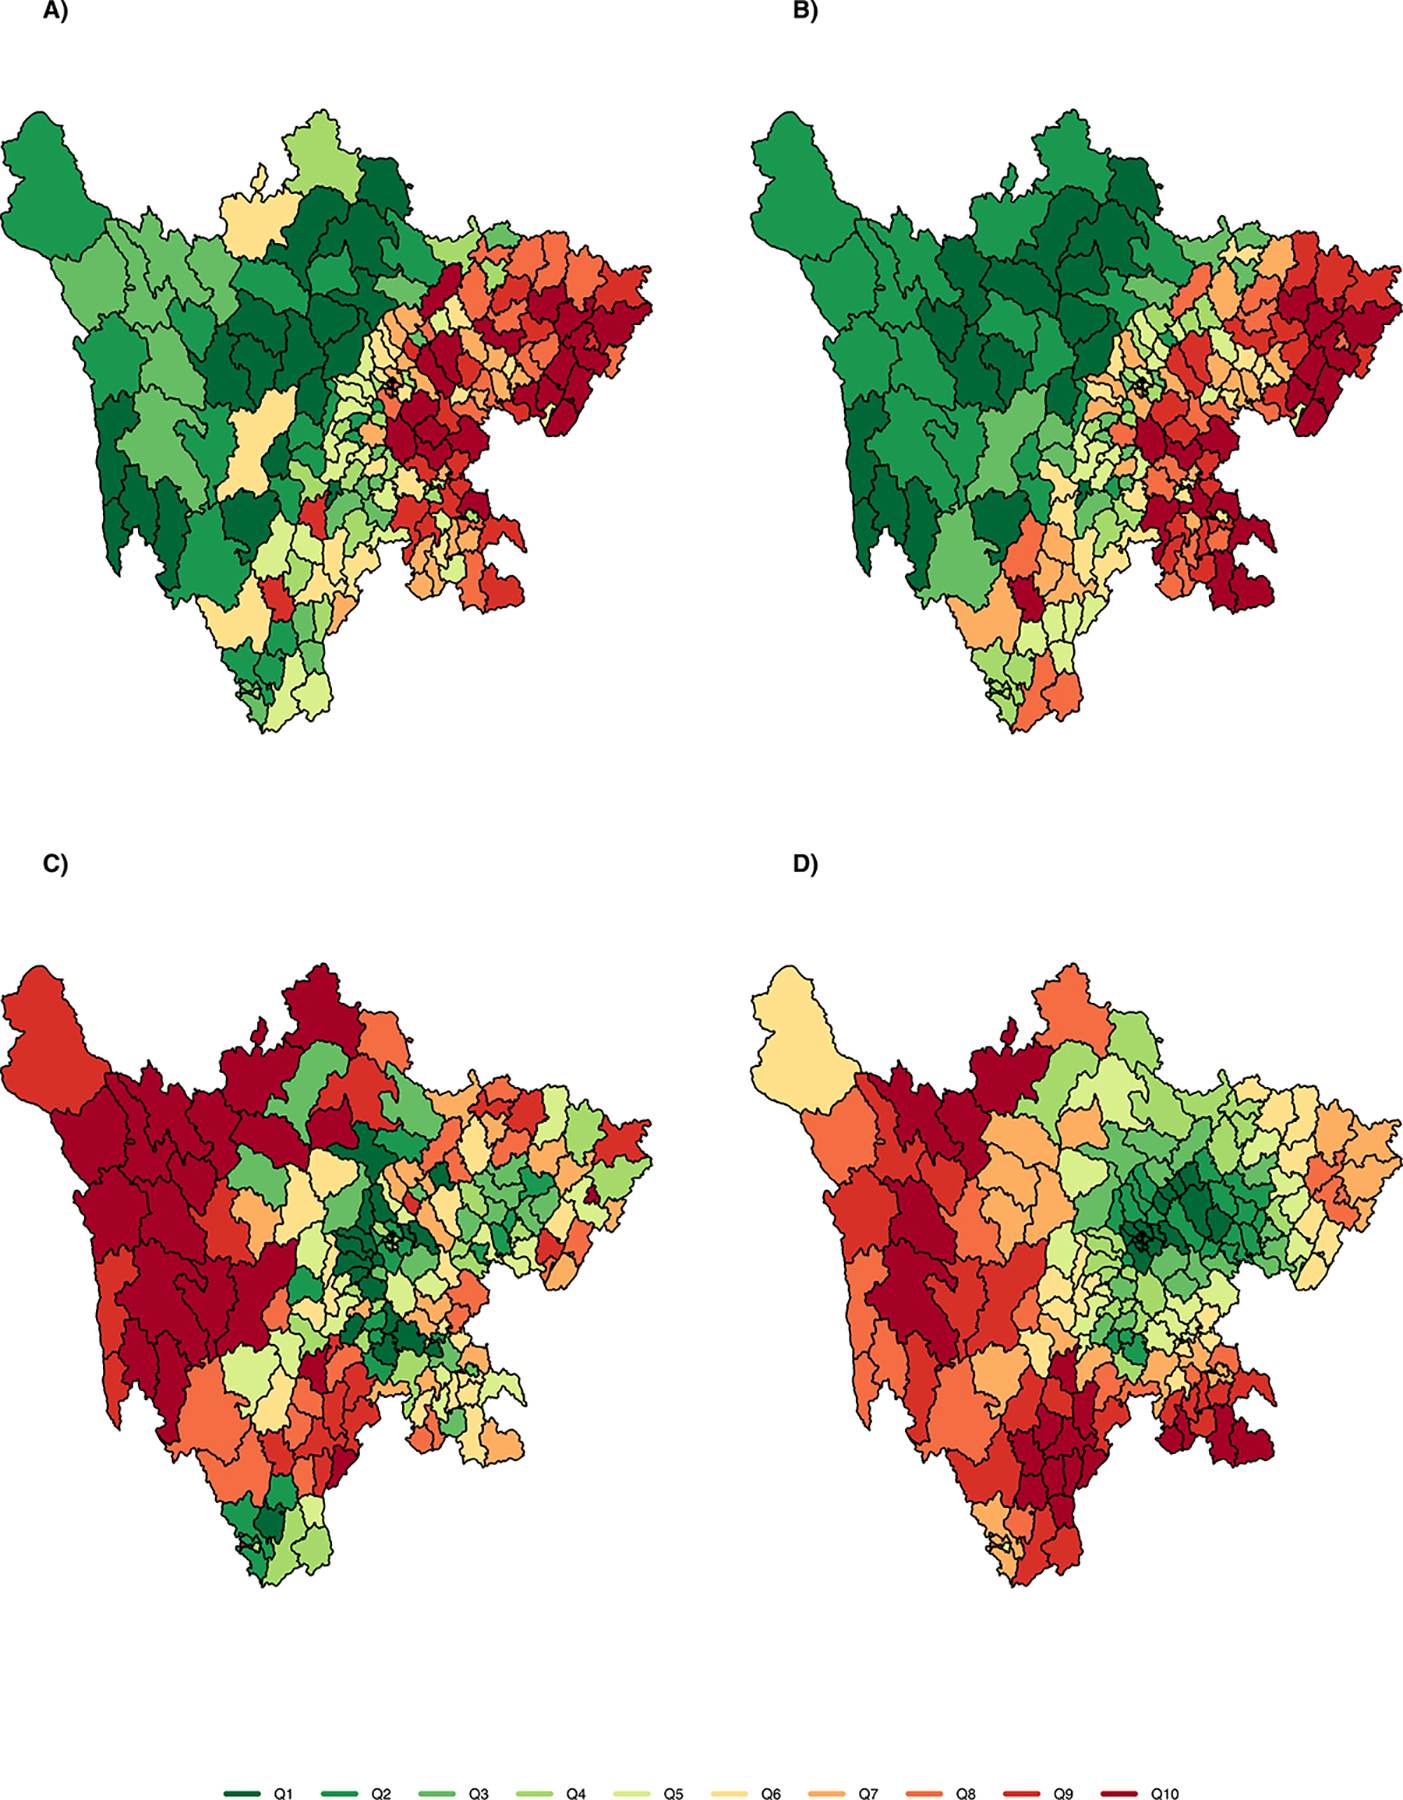
Fig. 4.

Maps of study region showing county-level estimates in 2010 of: A) unadjusted counts of ascertained PTB cases; B) adjusted counts (i.e., estimated true number); C) unadjusted population prevalence; and D) adjusted population prevalence (i.e., estimated true prevalence). PTB counts and prevalence are shown in 10 quantiles to aid visualization, from low (green) to high (red).
