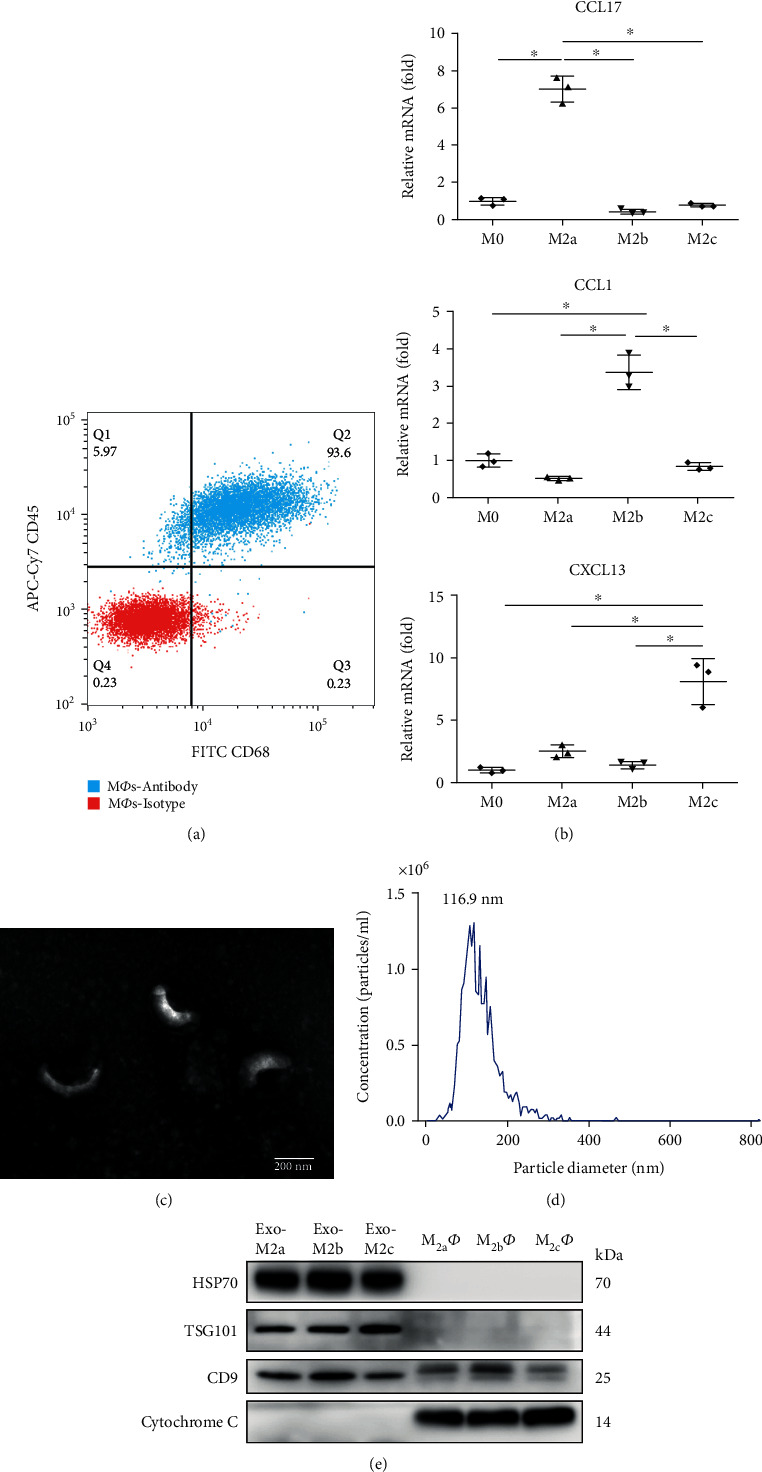
Figure 1.

Identification of M2Фs and exosomes. (a) Procedure for the identification of BMDMs positive for CD45 and CD68 by flow cytometry. (b) Gene expression profiles of the different M2Ф phenotypes measured by reverse transcription-quantitative PCR. M2aФs, M2bФs, and M2cФs expressed high levels of CCL17, CCL1, and CXCL13, respectively. Data are presented as fold changes relative to the expression levels in untreated BMDMs and are the mean of three independent experiments. ∗P < 0.05. (c) Representative transmission electron microscopy image of exosomes (scale bar, 200 nm). (d) The size and concentration of exosomes measured by qNano analysis. (e) Western blot analysis of exosome marker proteins and negative protein. BMDM: bone marrow-derived macrophage; CCL: C-C motif chemokine ligand; CXCL: C-X-C motif chemokine ligand.
