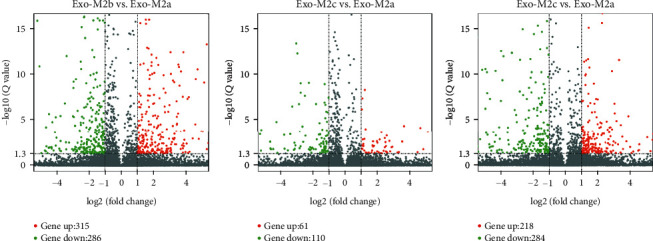
Figure 3.

Volcano plot comparing the levels of mRNA abundance between groups. Red and green dots represent upregulated and downregulated mRNAs (>2.0-fold change and P < 0.05), respectively.

Volcano plot comparing the levels of mRNA abundance between groups. Red and green dots represent upregulated and downregulated mRNAs (>2.0-fold change and P < 0.05), respectively.