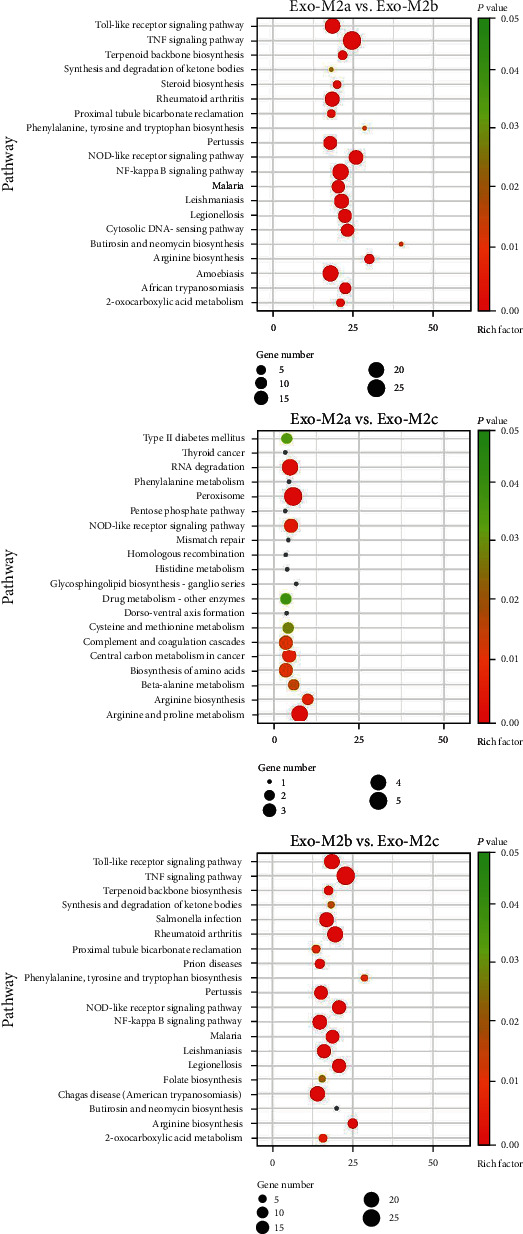
Figure 4.

KEGG pathway analysis of the differentially abundant mRNAs between groups. The size of the circles indicates the number of genes involved in the pathway, and the color of the circles represents the P value. The threshold for the analysis was set to P < 0.05 and FDR < 0.05. KEGG: Kyoto of Encyclopedia of Genes and Genomes; FDR: false discovery rate.
