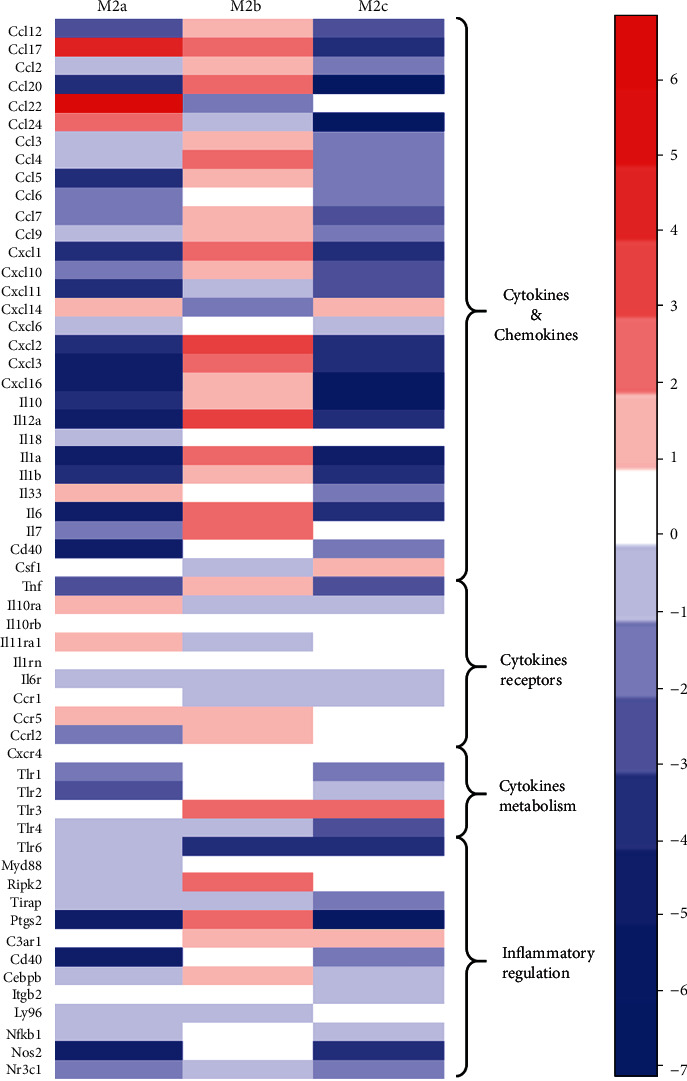
Figure 6.

Cluster analysis of the inflammation-associated mRNA profile of the exosomes from the three M2Ф subtypes. The ratios presented in this figure were determined by comparison to the mRNA expression of the exosomes from BMDMs. Each column represents the indicated sample; each row indicates a significant fold change in mRNA. Upregulated and downregulated genes are indicated in red and blue, respectively. BMDM: bone marrow-derived macrophages.
