
Figure 3.
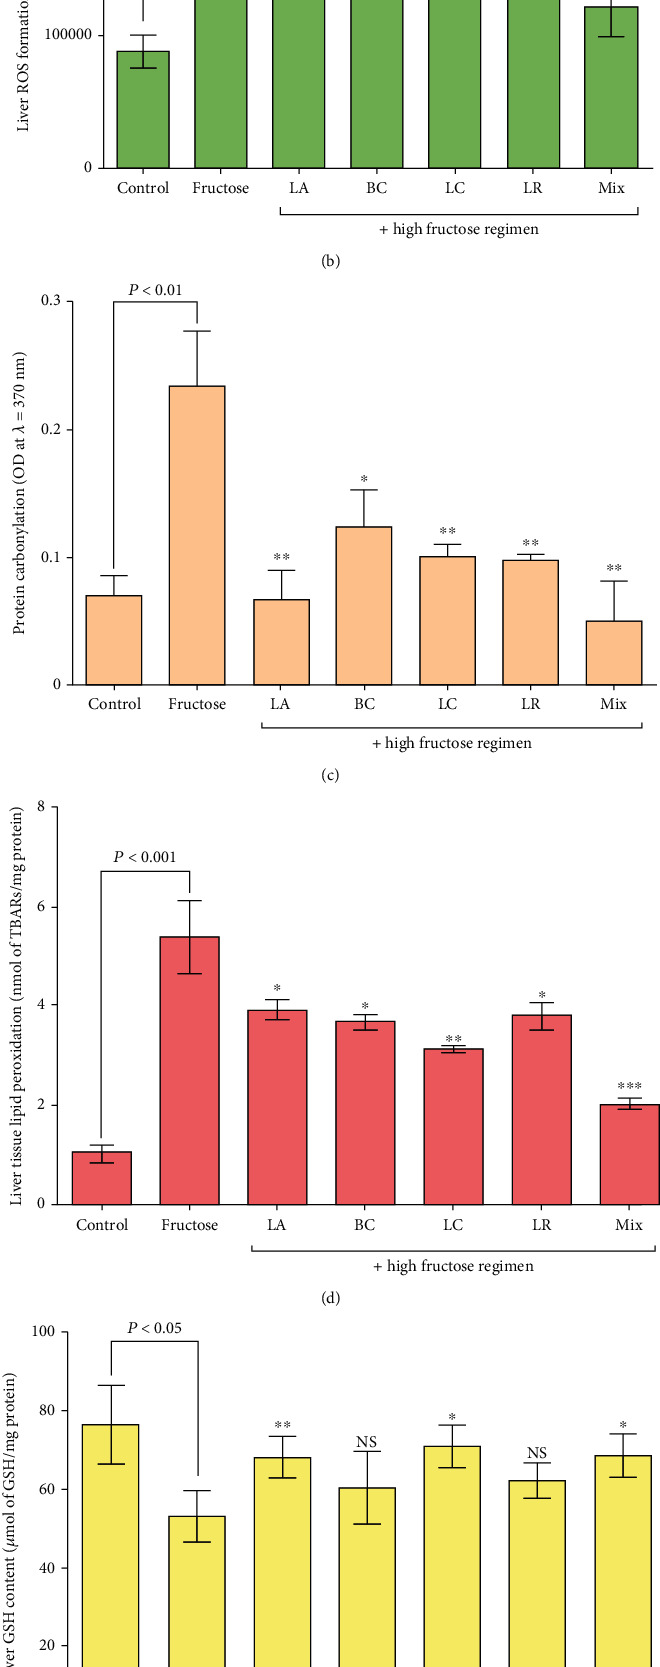
Oxidative stress markers in the liver tissue of NAFLD rats and effects of probiotic administration. Data are demonstrated as mean ± SEM (n = 6). (a) Liver tissue ferric-reducing/antioxidant power (FRAP) assay, (b) liver reactive oxygen species (ROS) formation, (c) liver protein carbonylation, (d) liver tissue lipid peroxidation, (e) hepatic glutathione content, and (f) liver tissue triglyceride level. Ctrl: control; LA: Lactobacillus acidophilus; BC: Bacillus coagulans; LC: Lactobacillus casei; LR: Lactobacillus reuteri; Mix: a mixture of probiotics inclusive of Lactobacillus acidophilus, Lactobacillus casei, Lactobacillus reuteri, and Bacillus coagulans; ns: not significant. ∗ indicates a significant difference from the fructose control group (P < 0.05). ∗∗ indicates a significant difference from the fructose control group (P < 0.01). ∗∗∗ indicates a significant difference from the fructose control group (P < 0.001).