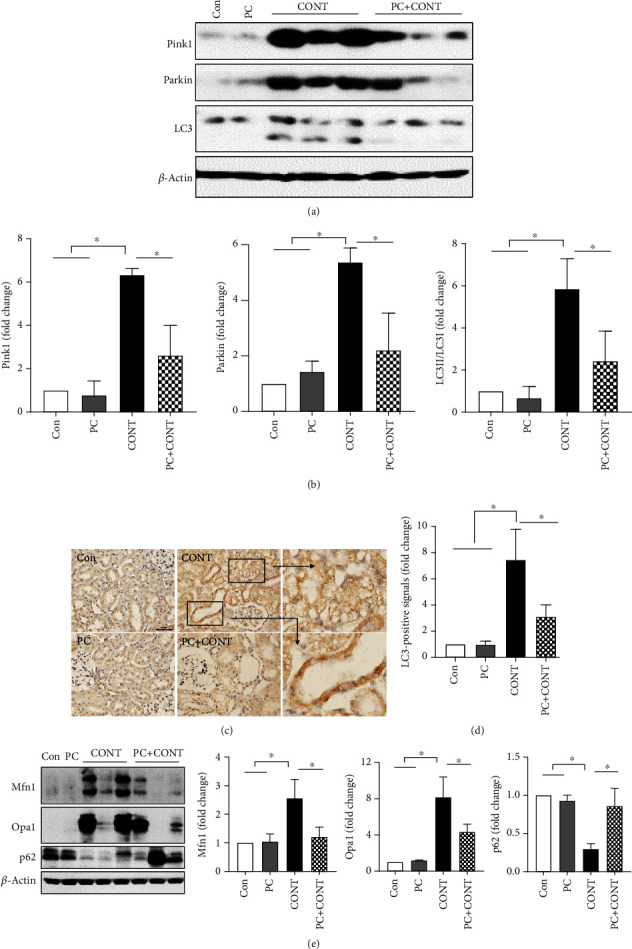
Figure 4.

Effects of paricalcitol on mitophagy in the kidney after ioversol administration. (a, b) Immunoblot analysis was performed with a specific antibody against PINK1, Parkin, and LC3. β-Actin was used as loading control, and data were normalized against the density of β-actin. Blots are representative of each group. Cropped blots are displayed here, and full-length blots are included in the section of Supplementary Information. (c, d) Immunohistochemical staining was performed with a specific antibody against LC3. Densitometric quantification for LC3 was applied to each group. Images are representative of each group. (e) Immunoblot analysis for Mfn1 and Opa1 was performed to confirm the effect of paricalcitol on mitophagy, and p62 is for the effect of paricalcitol on the autophagic flux. Con: PBS-treated group; PC: paricalcitol-treated group; CONT: ioversol-treated group; PC+CONT: paricalcitol- and ioversol-treated group. Data were presented as mean ± SEM (∗P < 0.05).
