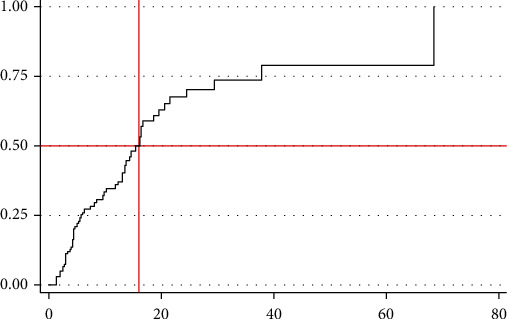
Figure 2.

Overall Kaplan-Meier relapse estimate among children with nephrotic syndrome in comprehensive specialized hospitals of Tigray region, Northern Ethiopia, 2019 (N = 174). The y-axis represents the probability of relapse whereas the x-axis indicates the analysis time in months.
