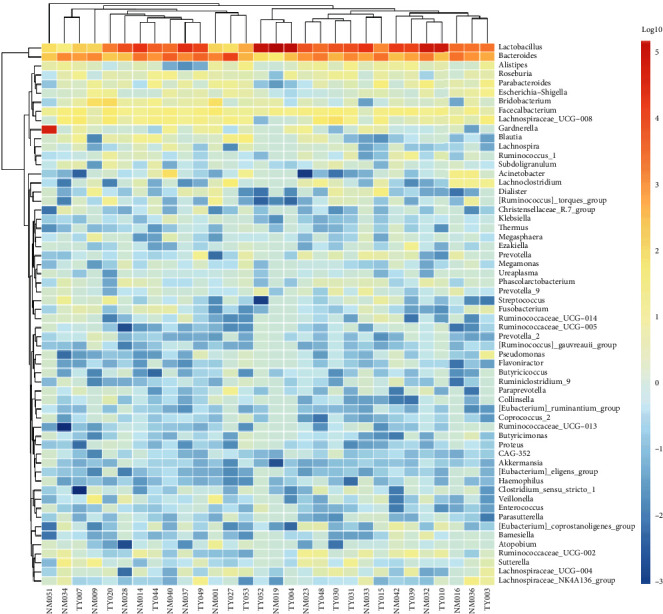
Figure 2.

Heatmap clustering for vaginal microbiota at the genus level. Top 100 representative 16 s rRNA gene-based bacterial sequences classified at the genus level. Red indicates higher abundance, while green and blue represent progressively decreasing abundance.
